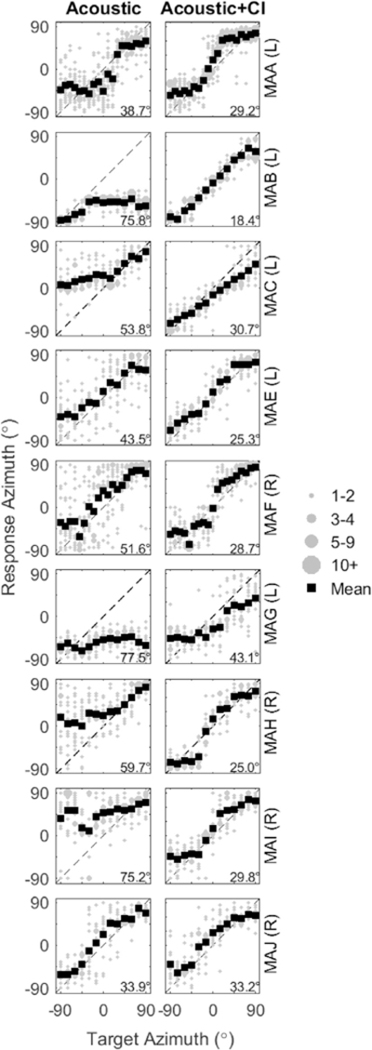
Fig. 5.

Sound localization responses of the 9 subjects with single-sided deafness and a cochlear implant (CI) (SSD-CI) are shown in two conditions: Acoustic (left panels) and Acoustic + CI (right panels). Each panel represents data from one subject in one condition, such that responses are plotted as a function of target angle from −90° to +90°. Responses were binned at 5_ intervals as a function of the source location, and the size of the symbol represents the number of responses at that location. Averages of the responses are shown in black filled squares. Root mean square (RMS) values for each listener are reported in the top left of each plot. The diagonal dashed lines represent the line of unity along which correct responses would appear. Next to the subject code, the ear that had acoustic hearing is shown in parentheses.
