
Fig. 8.
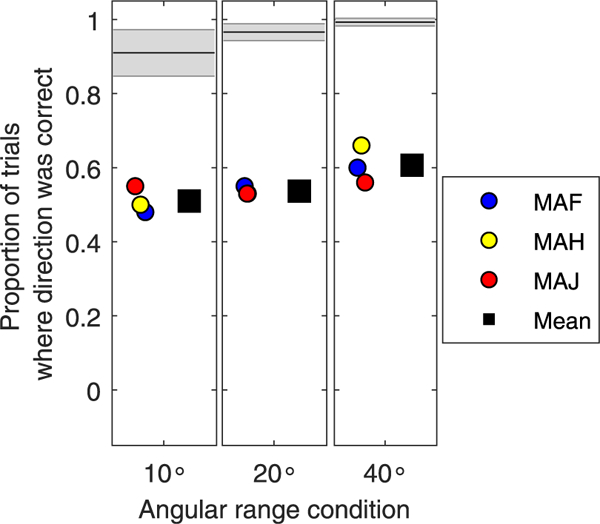
Proportion of trials on which the sound source was reported as moving and the direction of movement was correct, is shown for each angular range condition tested (10_, 20_, 40_). The individual data points represent the 3 listeners with single-sided deafness and a cochlear implant (CI) (SSD-CI), who had heard sounds as moving, and the mean is shown as the square symbol. The normal hearing (NH) mean and standard deviation are shown in the black lines and shaded grey areas, respectively.