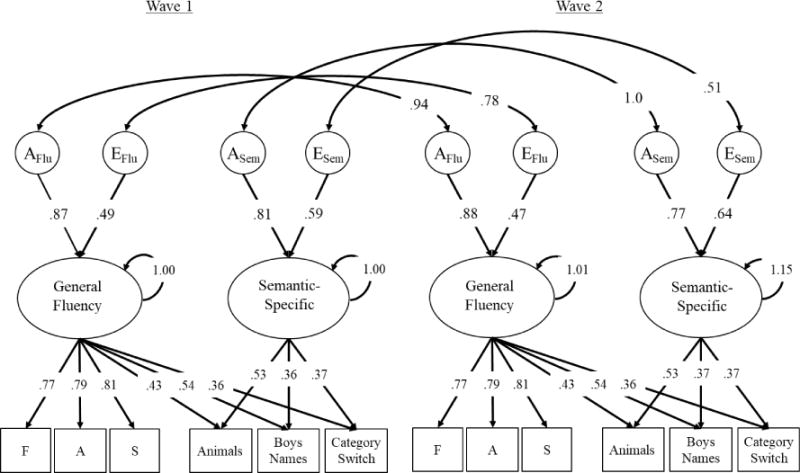
Figure 3.

Longitudinal model of verbal fluency between wave 1 (mean age 56) and wave 2 (mean age 62). AEs represent genetic (A) and non-shared environmental (E) influences on the fluency latent variables. Ellipses represent latent variables and rectangles represent measured variables. Curved arrows pointing from a latent variable to itself represent variances of that latent variable. Significant factor loadings and correlations are displayed with black text and lines (p < .05). Latent variable means are not shown but fixed at 0 for General Fluency and Semantic-Specific at wave 1 and estimated at −.22 and −.01 (respectively) at wave 2. AE latent variables and all factor loadings are standardized at both waves. Residual AE paths on individual subtest are not displayed, but are similar to those cross-sectional association presented in Figure 2 (see supplement Table S5).
