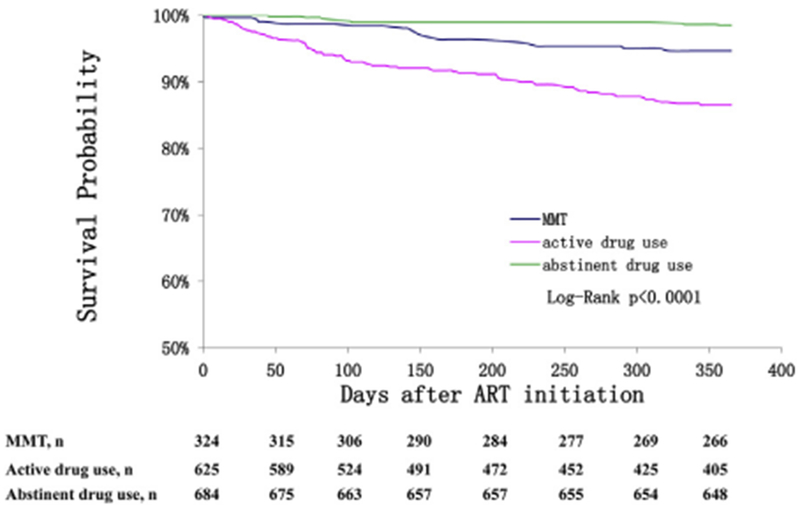
Fig. 2.

Kaplan-Meier survival curves by study group.
Comparison of survival curves from ART initiation to the 12-month follow-up for the MMT group, the active drug use group, and the abstinent drug use group.

Kaplan-Meier survival curves by study group.
Comparison of survival curves from ART initiation to the 12-month follow-up for the MMT group, the active drug use group, and the abstinent drug use group.