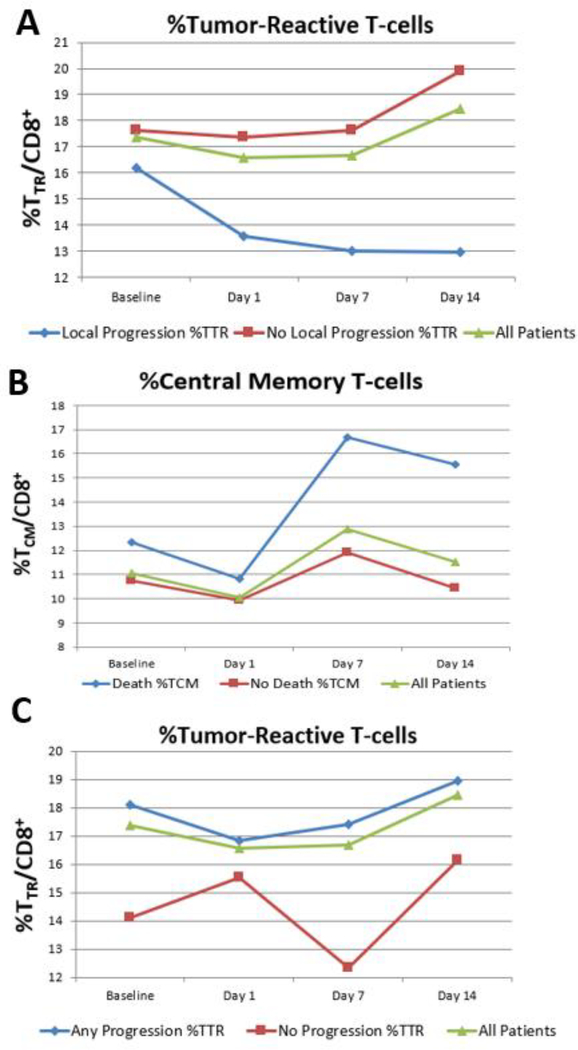
FIGURE 3. Changes in CD8+ T-cell subpopulations that correlate with significant clinical outcomes.
Graphs demonstrate the mean percentage change in (A) Tumor-Reactive (TTR) T-cells as a function of time at baseline before metastasis-directed SBRT and 1, 7 and 14 days after SBRT for patients that experienced local progression (blue), did not experience local progression (red), and all patients (green). (B) Mean percentage change in Central Memory (TCM) T-cells as a function of time at baseline before metastasis-directed SBRT and 1, 7, and 14 days after SBRT for patients that died (blue), remain alive (red), and all patients (green). (C) Mean percentage change in Tumor-Reactive (TTR) T-cells as a function of time at baseline before metastasis-directed SBRT and 1, 7, and 14 days after SBRT for patients that experienced any progression (blue), did not experience progression (red), and all patients (green).

