Figure 1.

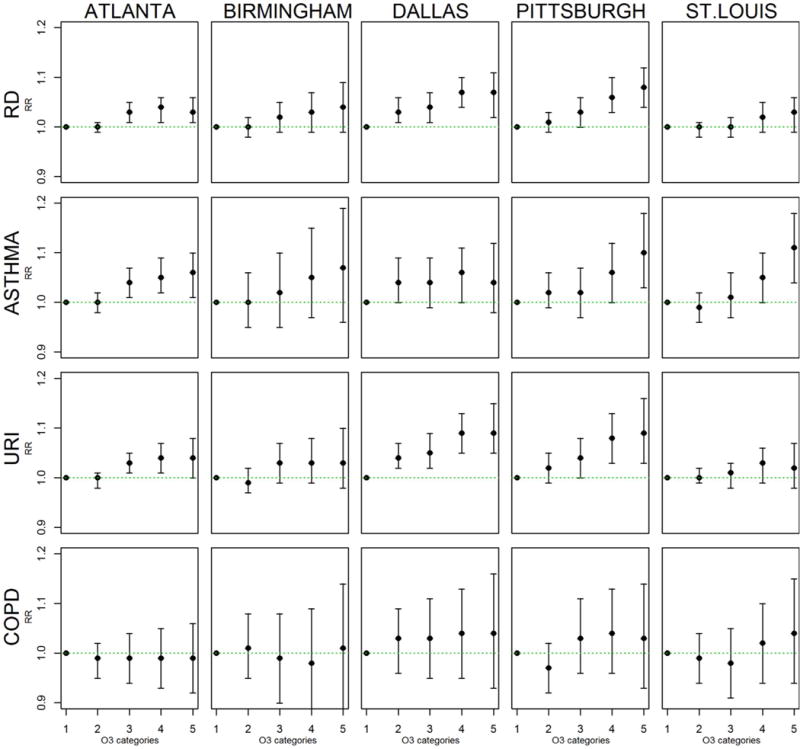
Rate ratios and 95% confidence intervals from categorical C-R models. O3 categories are <25 ppb (reference), 25 to <35 ppb, 35 to <45 ppb, 45 to <60 ppb, and ≥60 ppb.

Rate ratios and 95% confidence intervals from categorical C-R models. O3 categories are <25 ppb (reference), 25 to <35 ppb, 35 to <45 ppb, 45 to <60 ppb, and ≥60 ppb.