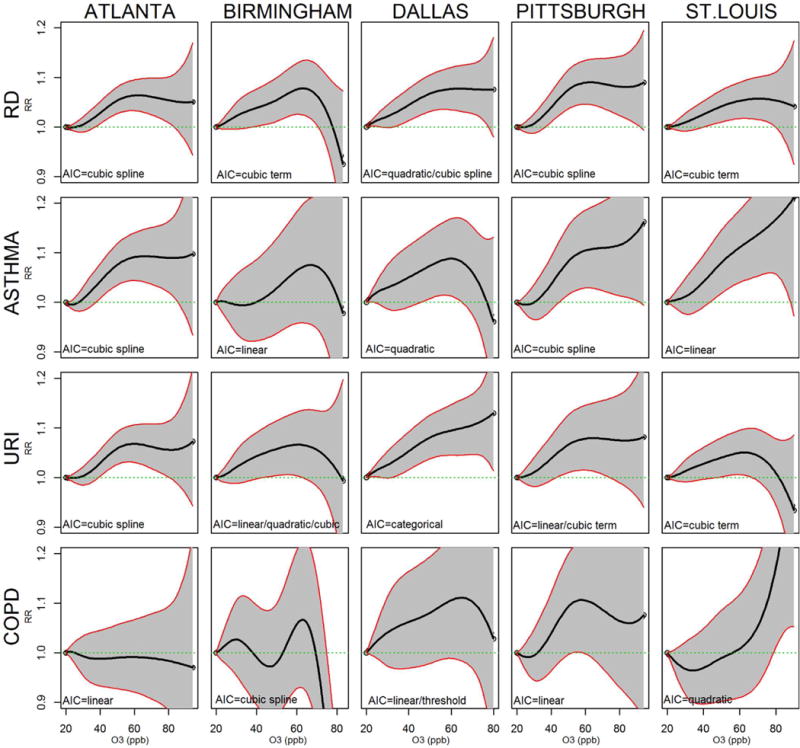
Figure 2.

Rate ratios and 95% confidence intervals from cubic spline C-R models. Rate ratios use O3 of 20 ppb as reference.a The best fitting model across all six O3 modeling approaches, as determined by AIC, is also listed on each figure for comparison purposes.
a20 ppb and 60 ppb correspond to 10th and 90th O3 percent
