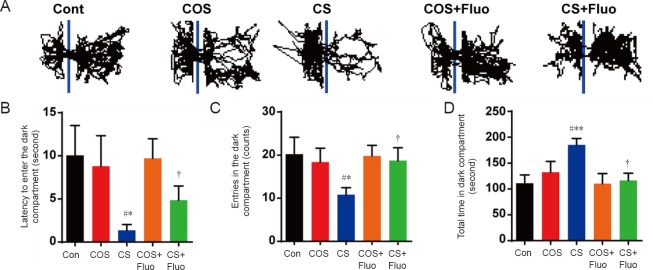
Figure 3.
Effect of cat odor stress and cat stress on behavior in the dark-avoidance test.
The effect of cat odor stress and cat stress on (A) movement (the representative trace of an individual mouse), (B) the latency to enter the dark compartment, (C) the number of entries into the dark compartment, and (D) the total time spent in the dark compartment in dark-avoidance test, which was implemented on day 22. Data are expressed as the mean ± SEM (n = 7 per group; one-way analysis of variance and Tukey’s post hoc tests). *P < 0.05, **P < 0.01, vs. Con; #P < 0.05 vs. COS; †P < 0.05, vs. CS. Con: Control; COS: cat odor stress; COS + Fluo: cat odor stress + fluoxetine; CS: cat stress; CS + Fluo: cat stress + fluoxetine.

