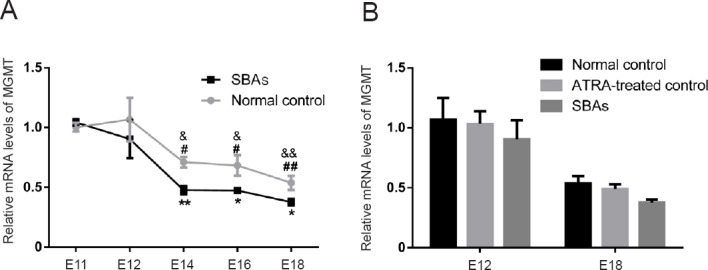
Figure 2.

RT-PCR analysis of the DNA repair gene MGMT.
(A) Expression profiles of MGMT in normal control (grey, n = 5 at each time point) and SBA (black, n = 5 at each time point) spinal cords, as detected by RT-PCR. #P < 0.05, ##P < 0.01, vs. the E11 control group; &P < 0.05, &&P < 0.01, vs. the E12 control group (Student’s t-test); *P < 0.05, **P < 0.01, vs. normal control group; Data are shown as the mean ± SEM (n = 5 at each time point; one-way analysis of variance followed by Fisher’s least significant difference post hoc test). (B) RT-PCR analysis of MGMT in normal control, ATRA-treated control and SBAs group on E12 and E18. Data are shown as the mean ± SEM (n = 5 at each time point, Student’s t-test). MGMT: O6-methylguanine DNA methyltransferase; SBA: spina bifida aperta; RT-PCR: real time-polymerase chain reaction; E: embryonic day.
