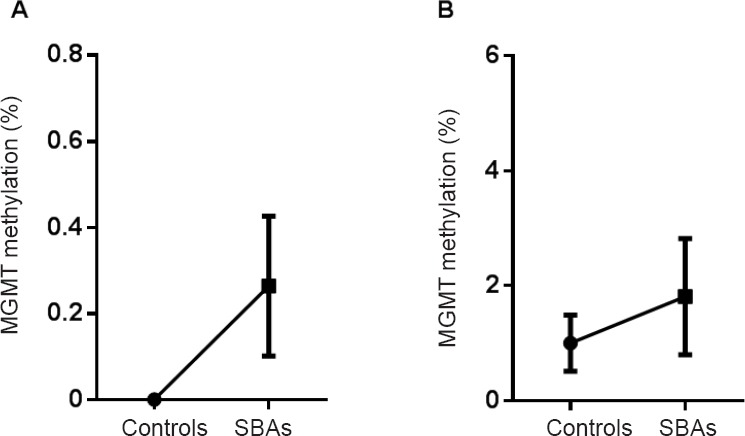
Figure 6.

Methylation levels of the MGMT promoter in the SBA and normal control groups on E14 and E18.
(A, B) Error bar plot showing mean methylation levels at E14 (A) and E18 (B) in spinal cords (n = 5 per group at each time point) between SBA and control groups for MGMT methylation analysis by BSP. The bottom and top of the bar represent the 25th and 75th percentiles (the lower and upper quartiles, respectively), and the band near the middle of the bar represents the 50th percentile (the median). MGMT: O6-methylguanine DNA methyltransferase; SBA: spina bifida aperta; BSP: bisulfite sequencing PCR; E: embryonic day.
