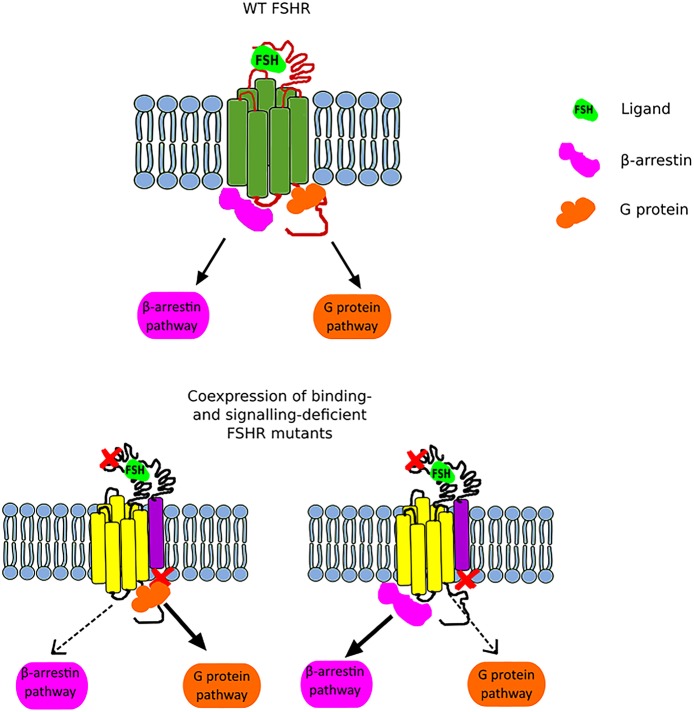
Figure 2.
Scheme illustrating the FSHR biased signaling. The upper part of the figure presents the G protein-dependent and β-arrestin-dependent signal transduction of the wild-type FSHR. The lower part of the figure shows the bias toward either the G protein-dependent pathway (left) or the β-arrestin pathway (right) when a binding-deficient and a signal-deficient FSHR are co-expressed.

