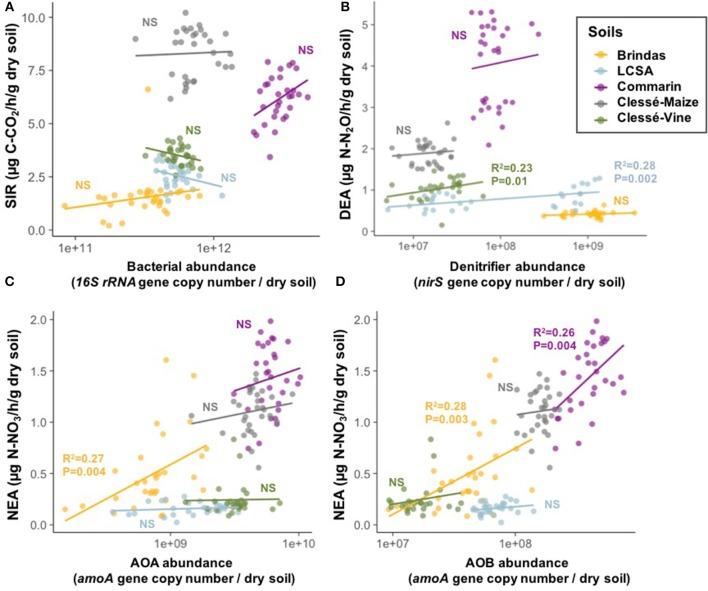
Figure 2.
Correlations between microbial activities and microbial abundance in the five soils on day 90. (A) SIR vs. bacterial abundance, (B) DEA vs. nirS-bearing denitrifier abundance, (C) NEA vs. AOA abundance and (D) NEA vs. AOB abundance. When a correlation is significant, the R2 and P-value are indicated, otherwise NS for Non-Significant is displayed.

