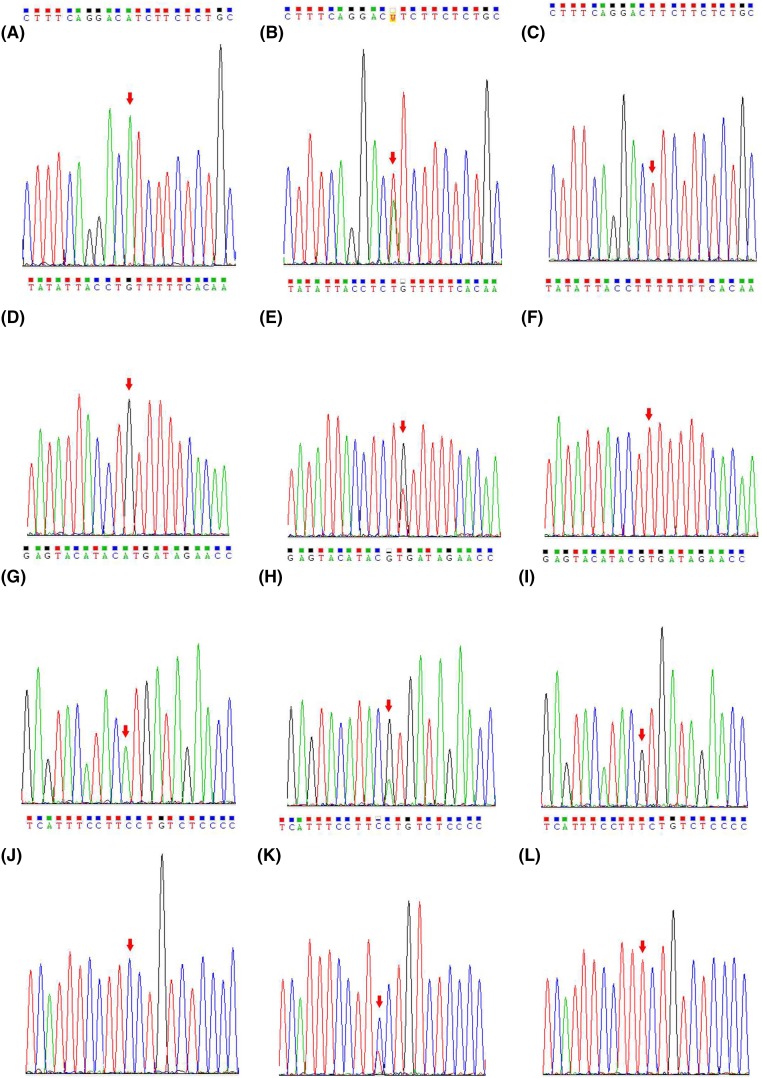
Figure 1. The results of Sanger sequencing of the CTSS SNPs loci.
(A) AA genotype at rs774320676 locus; (B) AT genotype at rs774320676 locus; (C) TT genotype at rs774320676 locus; (D) GG genotype at rs768437857 locus; (E) GT genotype at rs768437857 locus; (F) TT genotype at rs768437857 locus; (G) AA genotype at rs928508030 locus; (H) AG genotype at rs928508030 locus; (I) GG genotype at rs928508030 locus; (J) CC genotype at rs2275235 locus; (K) CT genotype at rs2275235 locus; (L) TT genotype at rs2275235 locus.

