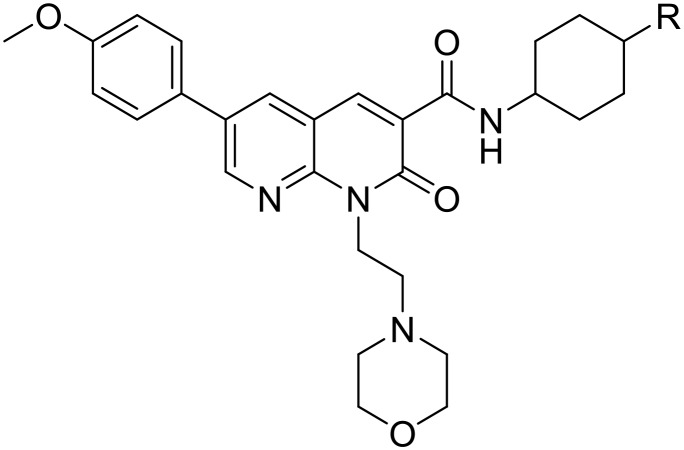
Table 2. Affinity and functional data of cyclohexyl-linked naphthyridines.

| |||||||||
| R | CB2 receptor |
CB1 receptor |
CB2 selectivity e | ||||||
| pKi a (±SEM) | pIC50 b , c (±SEM) | E max b , d (% ± SEM) | pKi a (± SEM) | pIC50 b , c (±SEM) | E max b , d (% ± SEM) | ||||
| 20 | cis | OH | 5.66 ± 0.07 | 6.74 ± 0.16 | 156 ± 5.5 | <5 | — | 117 ± 2.4 f | >4 |
| 21 | trans | OH | 5.47 ± 0.10 | — | — | No binding | — | — | — |
| 28 | cis | OC(O)CH2NHAc | 5.99 ± 0.03 | 6.99 ± 0.11 | 154 ± 5.4 | <5 | No response g | 115 ± 6.5 f , g | >9 |
| 29 | trans | OC(O)CH2NHAc | <5 | — | — | No binding | — | — | — |
| 30 | cis | OC(O)C6H12NHAc | 5.51 ± 0.02 | 5.81 ± 0.15 | 179 ± 12.1 | <5 | — | 130 ± 2.6 f | >3 |
| 31 | trans | OC(O)C6H12NHAc | 5.43 ± 0.06 | — | — | <5 | — | — | >2 |
| 32 | cis | OC(O)CH2NH-BODIPY630/650-X | 6.33 ± 0.02 | 6.72 ± 0.18 | 210 ± 15.7 | <5 | — | 117 ± 3.5 h | >21 |
| 33 | trans | OC(O)CH2NH-BODIPY630/650-X | 5.23 ± 0.06 | — | — | <5 | — | — g | >1.6 |
| 34 | cis | OC(O)C6H12NH-BODIPY 630/650-X | 5.11 ± 0.04 | — | — | <5 | — | — | >1.2 |
| 35 | trans | OC(O)C6H12NH-BODIPY 630/650-X | No binding | — | — | <5 | — | — | — |
| 36 | cis | NHC(O)CH2NH-BODIPY630/650-X | <5 | — | — | <5 | — | — | |
aRadioligand binding performed with [3H]CP55 940 (1 nM) and HEK293-hCB2 or -hCB1 membranes. Data is the mean ± SEM of at least three experiments performed in triplicate. Compounds which at 10 μM significantly displaced [3H]CP55 940 but with <50% displacement are annotated as having pKi >5 M.
bcAMP levels measured in a BRET assay using a CAMYEL biosensor, in either HEK-293-hCB2 or hCB1 cells. Data is the mean ± SEM of at least three independent experiments conducted in duplicate.
cpIC50 calculated by concentration response.
d E max response (at 10 μM for compounds without pIC50 determined.
eCB2 receptor selectivity is calculated by: 10^(pKi CB2–pKi CB1).
fExcept which are two independent experiments performed in duplicate. ‘—’ Indicates that pIC50 or Emax was not determined.
gIndicates no significant difference from forskolin only (100%), indicating no measurable response.
hExcept which is at 1 μM due to high non-specific effects at 10 μ, see ESI), normalised to basal (0%) and forskolin only (100%) levels of cAMP. Emax >100% is consistent with inverse agonism.
