. 2018 Nov 7;54(99):13933–13936. doi: 10.1039/c8cc06309e

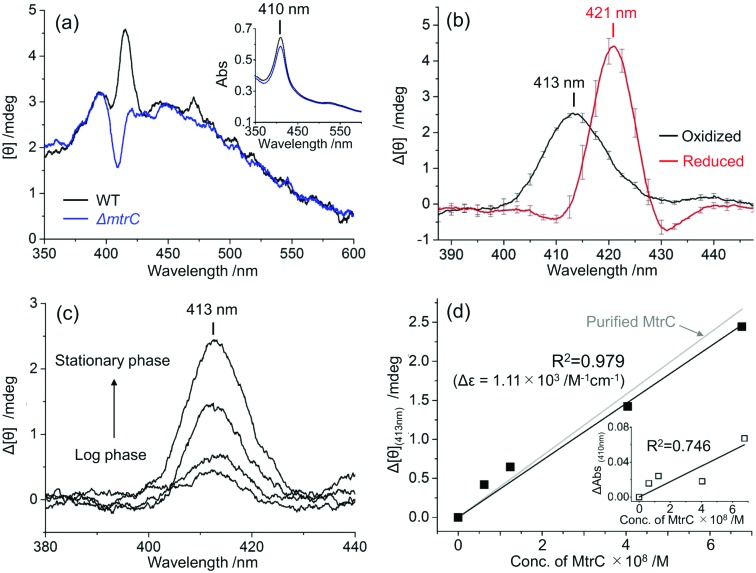
Fig. 2. (a) Circular dichroism (CD) spectra of whole S. oneidensis MR-1 cells (wild-type, WT; black line) and a mutant strain deficient for the mtrC gene (ΔmtrC; blue line). The cell density was adjusted to OD600 = 1.33 ± 0.02. Inset: Absorption spectra of the same samples in diffused transmission mode. (b) Differences in CD spectra between WT and ΔmtrC oxidized by oxygen (black line) and reduced by 30 mM lactate (red line). The error bars represent the mean ± SEM obtained using three individual samples and eight measurements each. (c) The differences in CD spectra between WT and ΔmtrC at various growth phases in the oxidized state. (d) Plots of the changes in CD signal intensity at 413 nm observed in (c) (Δ[θ](413nm)) against the MtrC concentration in the cell suspension. The squares of the correlation coefficients (R2 = 0.979, black line) include the point of origin. The gray line represents the CD signal intensity for purified MtrC at 412 nm estimated from Δε = 1.19 × 10³ M–1 cm–1. Inset: The plots of ΔAbs at 410 nm between WT and ΔmtrC against the MtrC concentration.

Fig. 2