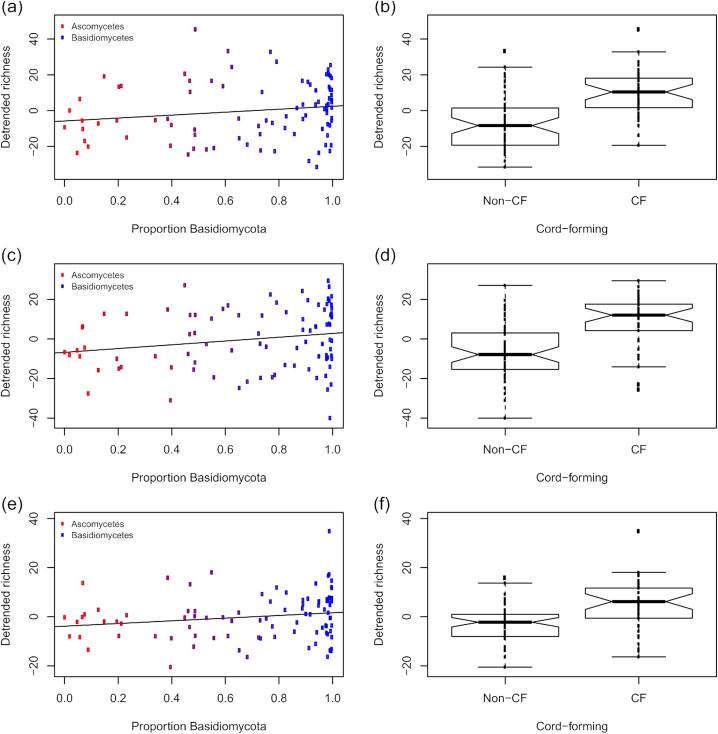
Figure 6.
OTU richness for selected bacterial families in fungus-colonised wood disks in relation to the fungi present. Residuals from models to correct for sequencing depth (the y-scale is therefore arbitrary). (a) Burkholderiaceae broken down by the relative proportions of ascomycete and basidiomycete reads; (b) Burkholderiaceae broken down by whether the dominant fungal OTU belonged to a cord-forming genus; (c)-(d) Acidobacteriaceae broken down by the same predictors and (d)-(f) Acetobacteraceae broken down by the same predictors. A simple regression line is overlaid on the scatterplots. Notches on boxplots represent 95% confidence intervals. Abbreviations are control (C), Vulleminia comedens (Vc), Trametes versicolor (Tv), Hypholoma fasciculare (Hf), Whitestone (WS), cord-former (CF).

