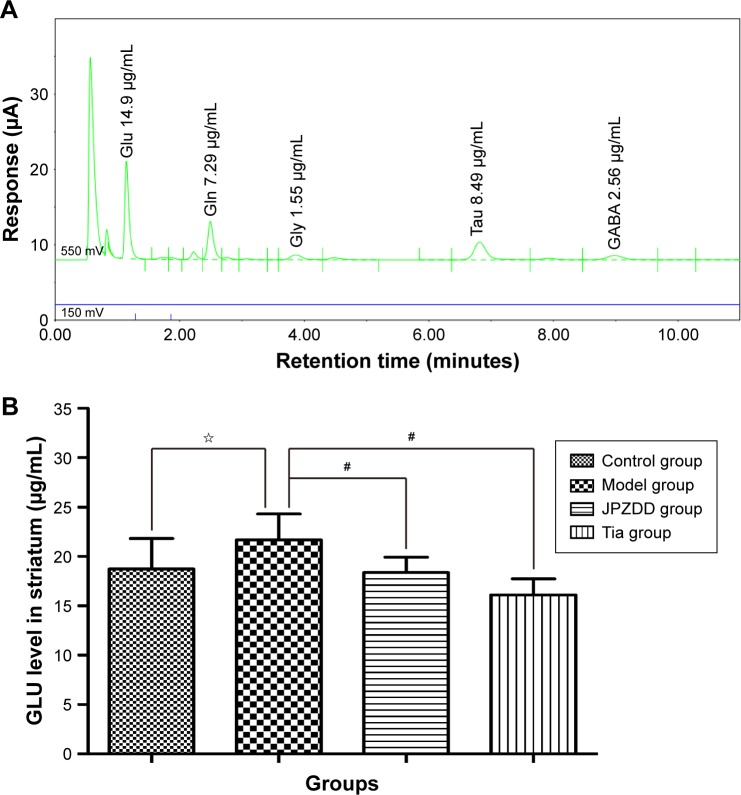
Figure 4.
Comparison of GLU level in the striatum.
Notes: (A) HPLC analysis of amino acids in the striatum: GLU, Gln, Gly, Tau, and GABA appeared in that order. (B) Comparison of glutamate concentration in the striatum after JPZDD and Tia treatments (n=8). P<0.05, control group vs model group; #P<0.01, JPZDD or Tia group vs model group.
Abbreviations: FI, fluorescence intensity; GABA, γ-aminobutyric acid; Gln, glutamine; Gly, glycine; GLU, glutamate; HPLC, high-performance liquid chromatography; JPZDD, Jian-Pi-Zhi-Dong-Decoction; Tau, taurine; Tia, tiapride.

