Figure 5.
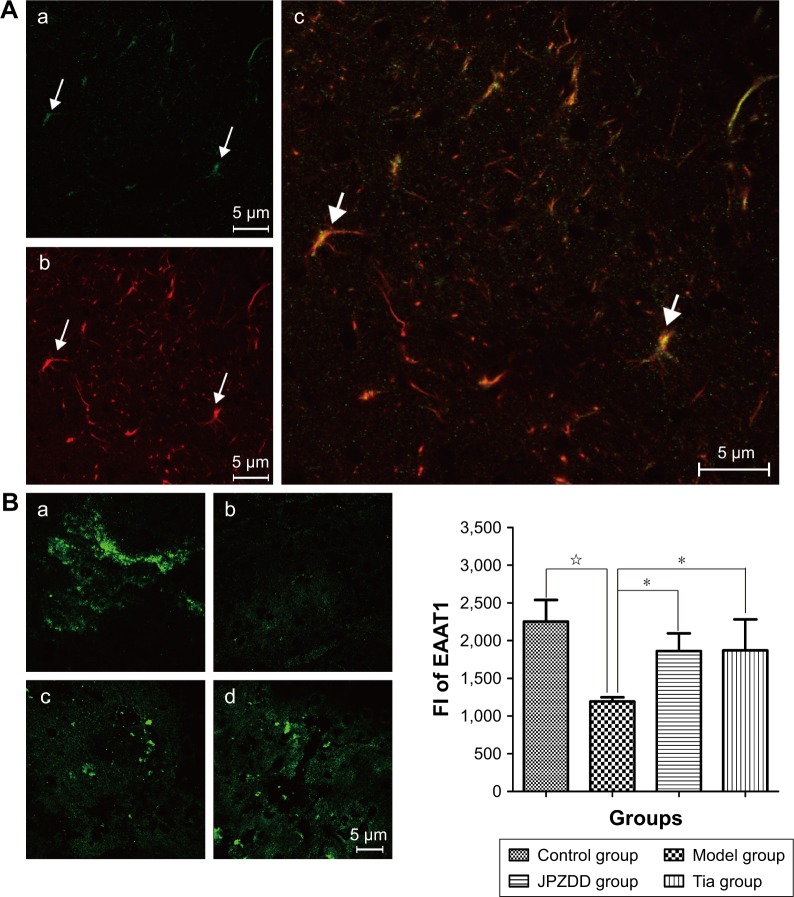
The expression of EAAT1 as determined by LSCM.
Notes: (A) Co-expression of EAAT1 and GFAP. (a) Positive EAAT1 staining with green fluorescence. (b) Glial cells labeled with GFAP (red fluorescence). (c) High co-expression of EAAT1 and glial cells showing a yellow color (white arrow) in a fixed region of interest (10×60 µm). (B) Expression of EAAT1 in the striatum after JPZDD and Tia treatment (n=6). Positive fluorescence of EAAT1 labeled with a green color. In the mixed picture, (a) to (d) represent the control, model, Tia, and JPZDD groups, respectively. P<0.05, control group vs model group; *P<0.05, JPZDD group or Tia group vs model group.
Abbreviations: EAAT1, excitatory amino acid transporter 1; FI, fluorescence intensity; JPZDD, Jian-Pi-Zhi-Dong-Decoction; LSCM, laser scanning confocal microscopy; Tia, tiapride.

