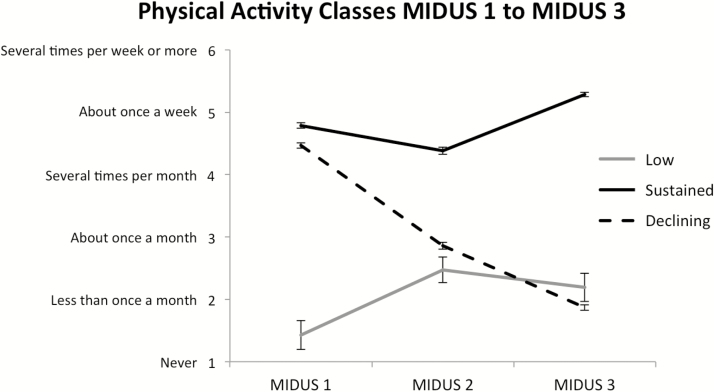
Fig. 1.
Longitudinal physical activity profiles identified by latent class analyses (N = 2,364). Profiles show those with consistently low activity (low; N = 80), sustained activity (sustained; N = 1,102), and those who declined (declining; N = 1,182) in activity over time. Error bars are SEM. MIDUS Survey of Midlife Development in the United States.

