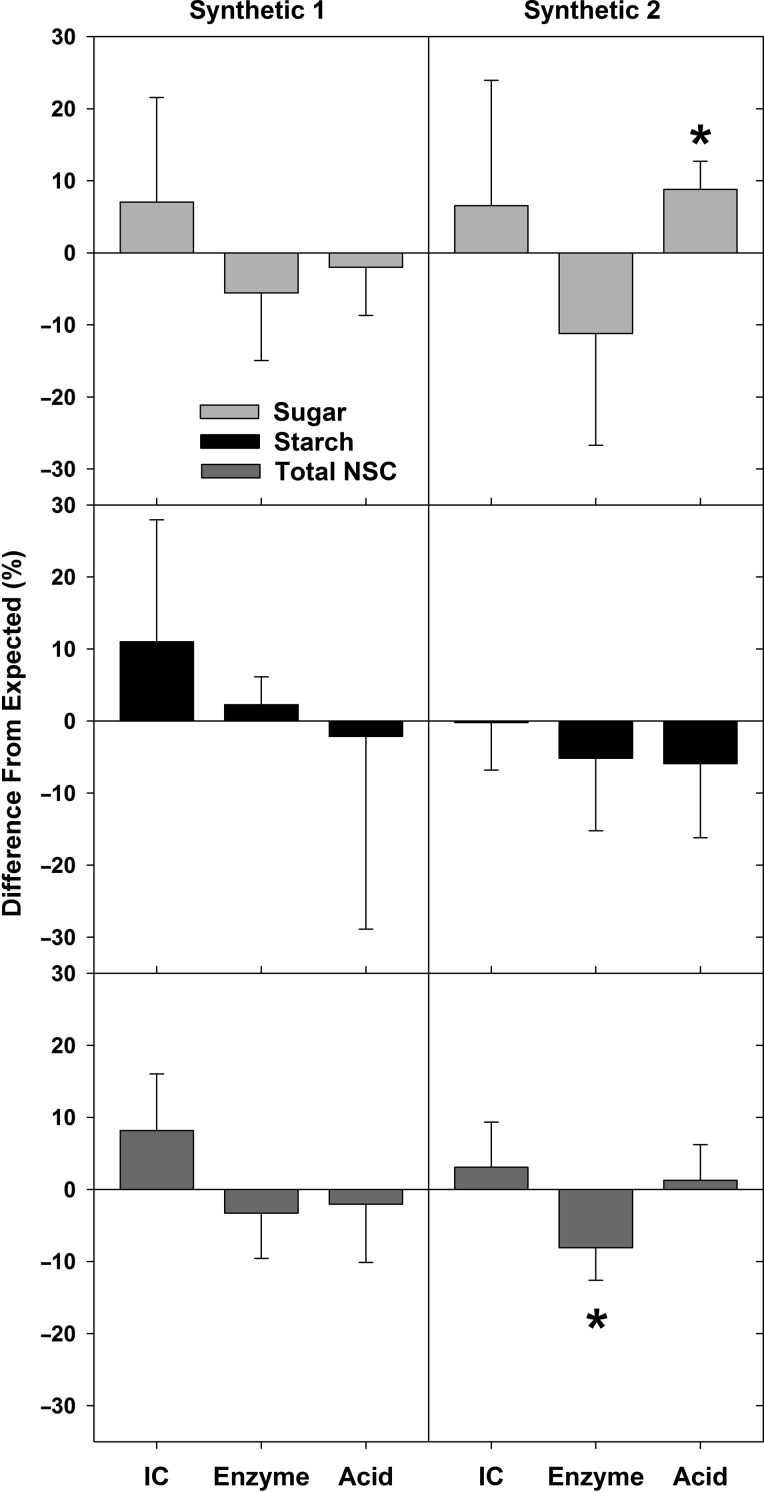
Figure 3.
Mean differences between measured values and expected (known) concentrations of sugar, starch and total NSC for the two constructed synthetic samples (s1 and s2). Differences are quantified as percent of the expected values (Figure 2) for each carbohydrate component of three extraction methods: IC, enzyme and acid. Significant differences from expected values (P < 0.05) are indicated with an asterisk, as determined from a one-sample t-test of measured concentrations and expected concentrations (same analysis as Figure 2). Error bars are one standard deviation.

