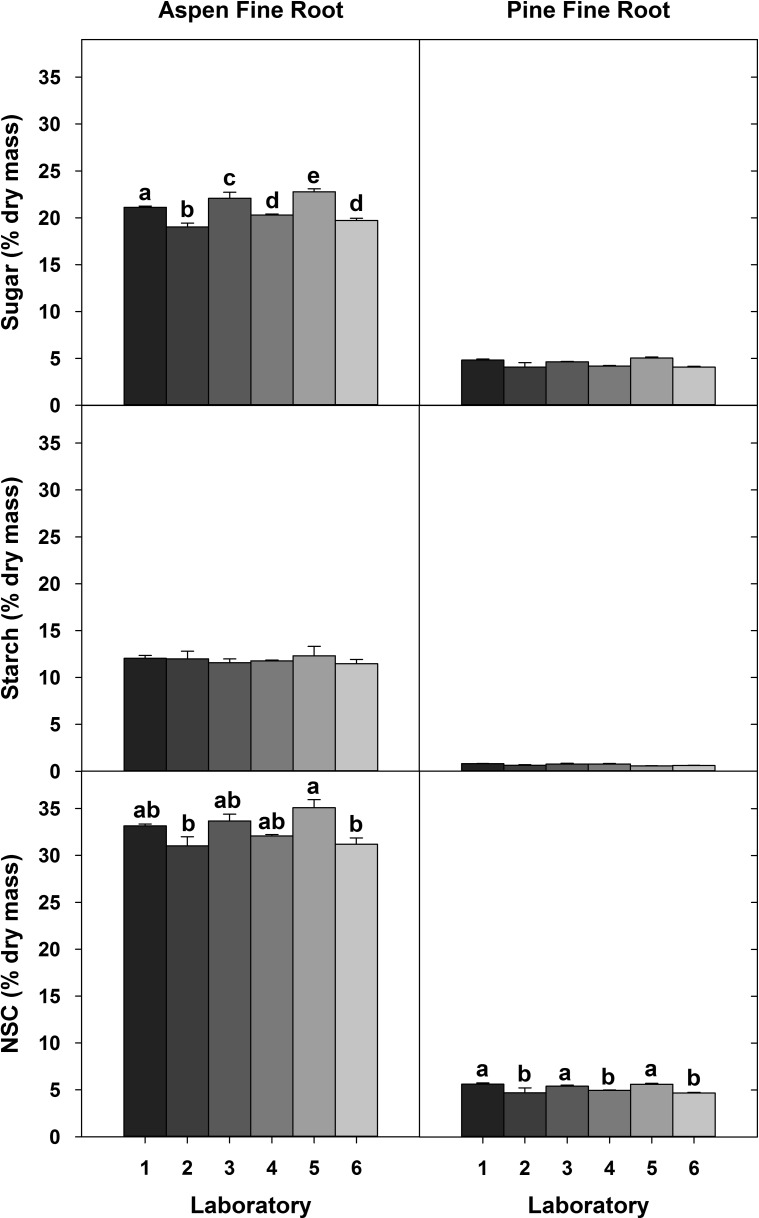
Figure 6.
Concentrations of sugar, starch and total NSC in plant samples that were extracted in six laboratories, but quantified centrally in one lab using the acid method. Letters indicate significant differences among labs for each plant material type for each carbohydrate pool (P < 0.05). Error bars are one standard deviation.

