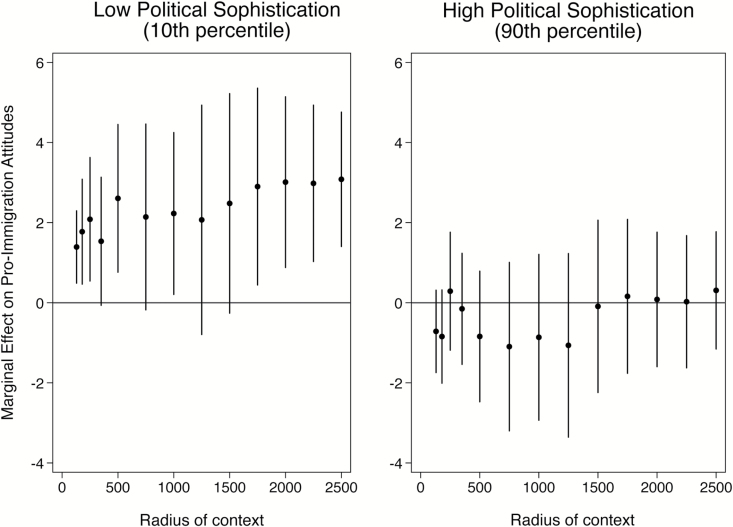
Figure 2.
The Effect of Neighborhood Exposure to Non-Western Immigrants on Pro-Immigration Attitudes for Individuals with Low (left panel) and High (right panel) Levels of Political Sophistication. The x-axis denotes the radius of the neighborhood within which the share of non-Western immigrants is measured. The dots show the estimated effect of a change from minimum to maximum in the share of non-Western immigrants within the given area. The vertical lines are 95 percent confidence intervals based on robust standard errors. The estimate for each radius is based on all available respondents with at least 20 individuals residing within the area specified by the radius.

