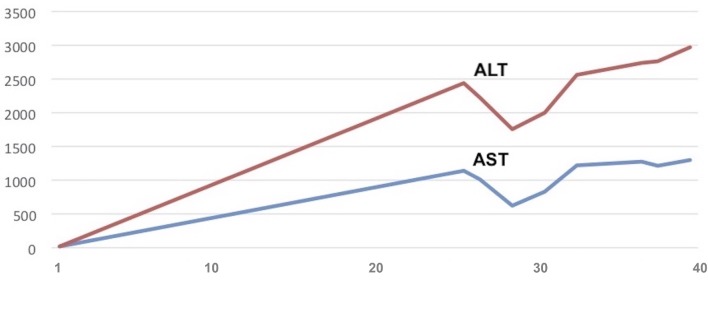
Figure 1.
Trend of liver function tests during recovery. The figure shows AST and ALT augmentation during hospitalisation. The horizontal axis specifies the day from admission. On the vertical axis AST (normal <46 U/L) and ALT (normal <66 U/L) values are reported. AST/ALT values remained high for about 2 weeks. ALT, alanine aminotransferase; AST, aspartate aminotransferase.

