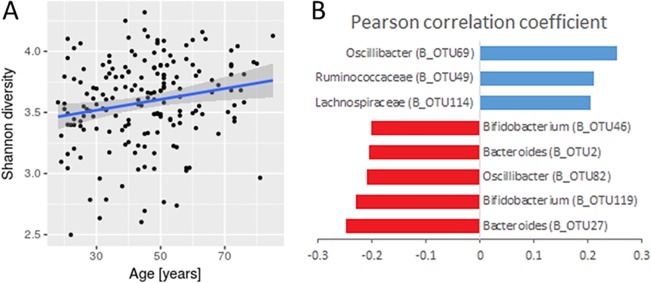
Fig 4. Age-associated changes in bacterial communities.
Graph shows bacterial community Shannon diversity index in relation to age. The linear regression indicates the increase of the Shannon diversity with age and is presented with a 95% confidence interval (A) (Pearson's r = 0.213, P = 0.003). The bar plot shows Pearson correlations of bacterial OTUs that significantly increase (blue) or decrease (red) in relative abundance with age (FDR < 0.05) (B).

