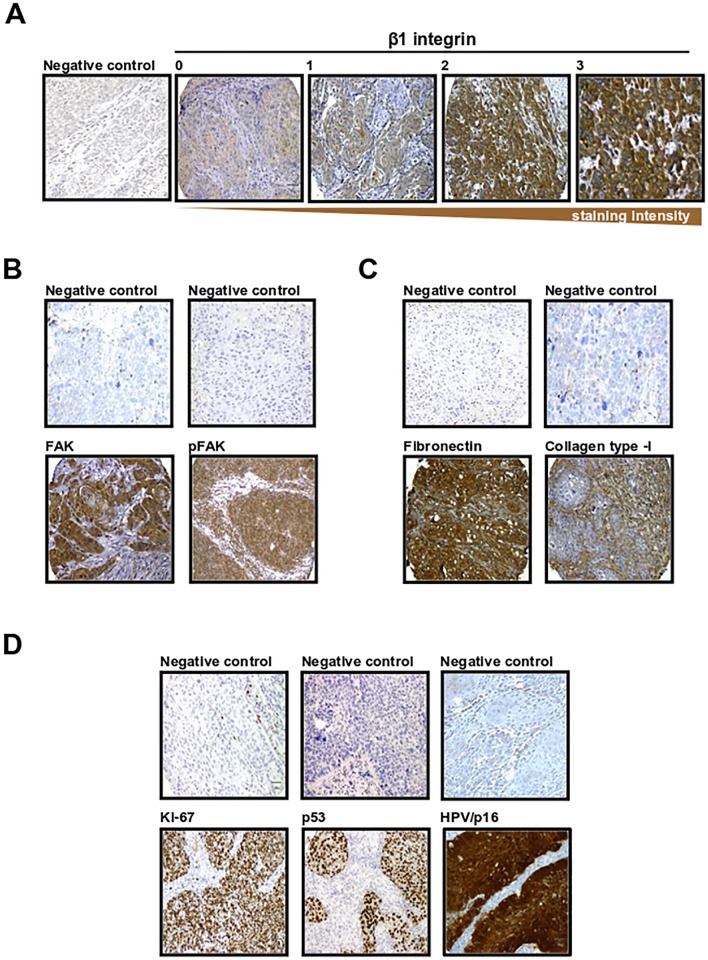
Fig 2. Immunohistochemical staining of β1 integrin and associated proteins.
Representative immunohistochemical staining of β1 integrin (A), FAK and phosphorylated FAK (pFAK) (B), associated ECM proteins (C), proliferation markers and HPV/p16 (D) in HNSCC specimens, including negative controls. Immunochemistry was performed on paraffin embedded tissue microarrays (TMA). A shows the four different β1 integrin expression scores (0 = absent; 1–3 increasing. B shows only score 3 stainings relative to the negative control. Magnification is x20 for all photographs.

