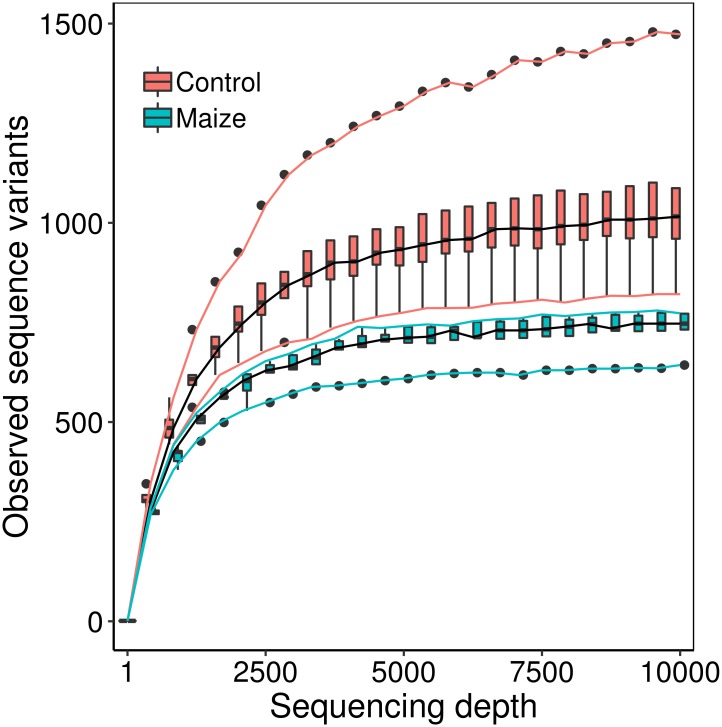
Fig 1. Rarefaction curve for the Sequence Variant number (richness).
At each sampling depth 10 random samples were taken, and the distribution of Sequence Variant numbers for all 5 samples per group are shown as boxplots (50 values per box plot). Maize-root soil samples are shown in blue, and bulk soil controls in red. Continuous lines show the most extreme values at each sampling depth.

