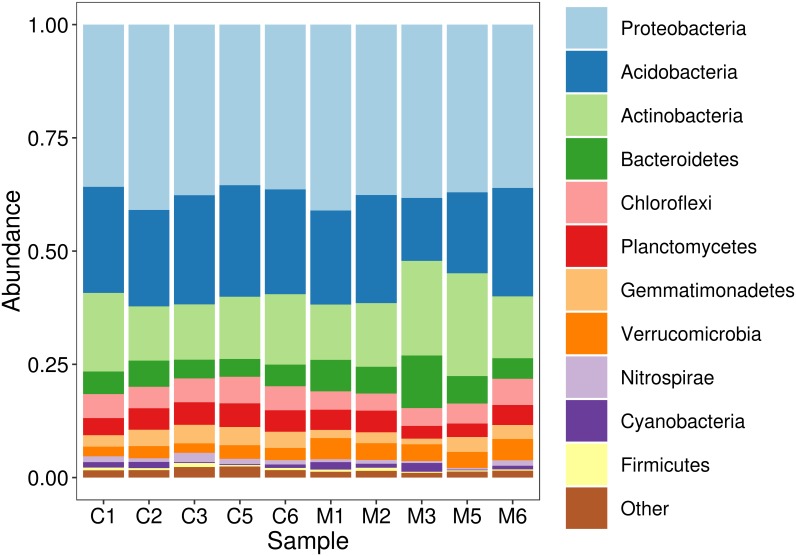
Fig 2. Histogram of the abundance of phyla of soil samples from the milpa at El Boxo.
Soil samples named with an initial "M" were taken at maize-plants roots, and samples named with an initial "C" are bulk-soil controls, taken at 30 cm from the plants. Phyla with relative abundance higher than 2% are shown.

