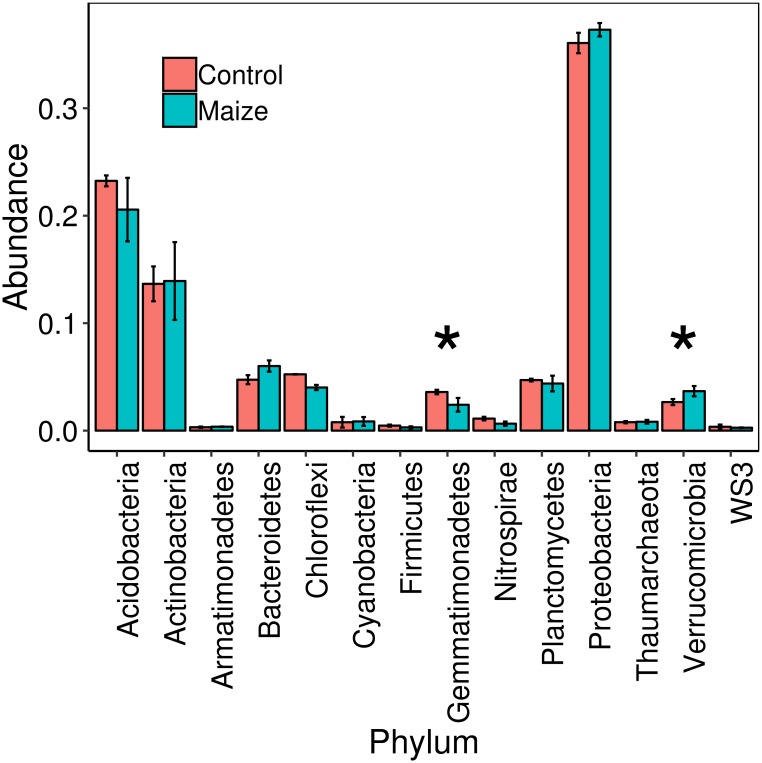
Fig 3. Abundance of phyla of soil samples from the milpa at El Boxo.
Values are medians, and error bars are interquartile ranges. Bars in blue are soil samples taken at maize-plants roots and red bars are bulk soil controls. Asterisks indicate statistically significant differences (Wilcoxon, p < 0.05).

