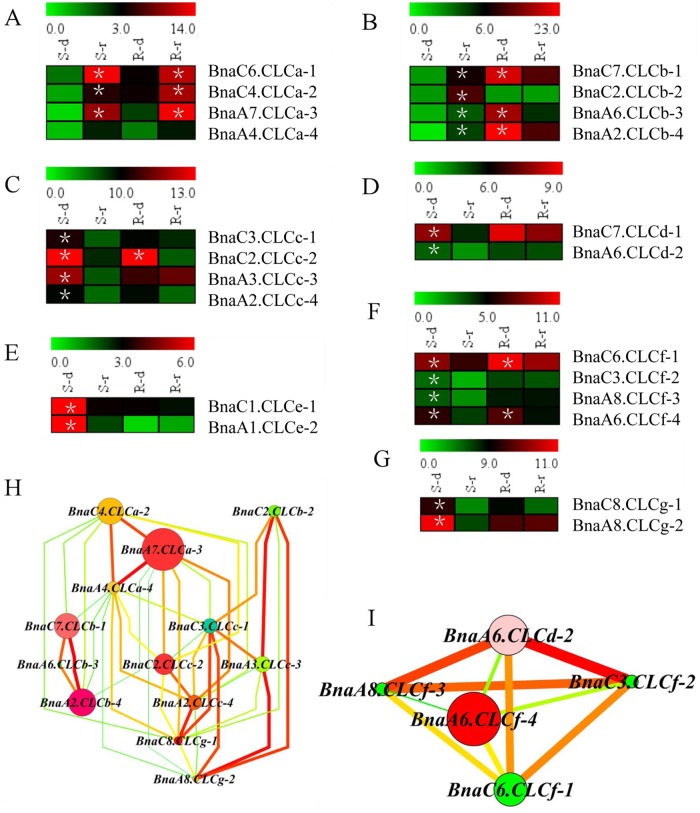
Fig 7. Expression profiling of the BnaCLCs in response to NO3- depletion and resupply in B. napus (A-G).
The shoots (S) and roots (R) were sampled separately for RNA seq. S-d shows shoot sample under NO3--depletion treatment, and S-r indicates shoot sample under NO3--resupply treatment. R-d represents root sample under NO3--depletion treatment, and R-r indicates root sample under NO3--resupply treatment. The asterisks denote significant differences at P < 0.05. Co-expression network analysis of the BnaCLCs (H, I). Cycle nodes represent genes, and the size of the nodes represents the power of the interaction among the nodes by degree value. Edges between two nodes represent interactions between genes.

