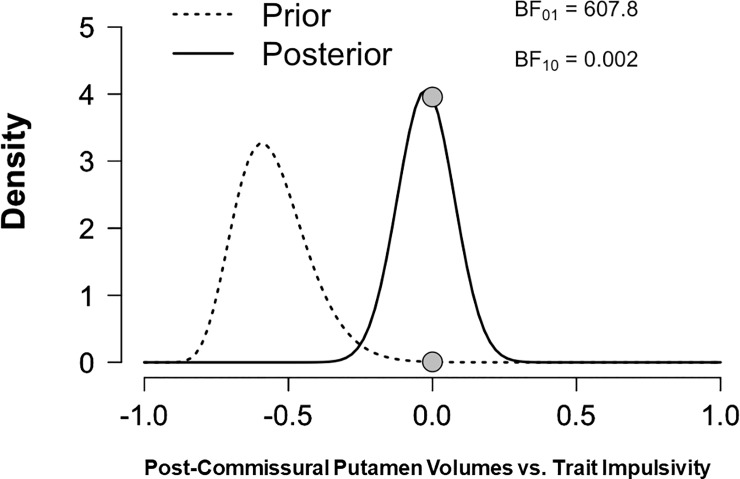
Fig 3. Replication bayes factor analysis.
The results of the replication Bayes Factor (BF) analysis. The dashed line (the “prior”) denotes the original relationship (previously published) between post-commissural putamen volumes and trait impulsivity, and the updated estimate (“the posterior”) from data from the current study. BF was calculated using the ratio between the heights of the prior and posterior at zero (denoted by the grey circles). The label “Density” on the y-axis refers to the probability density.

