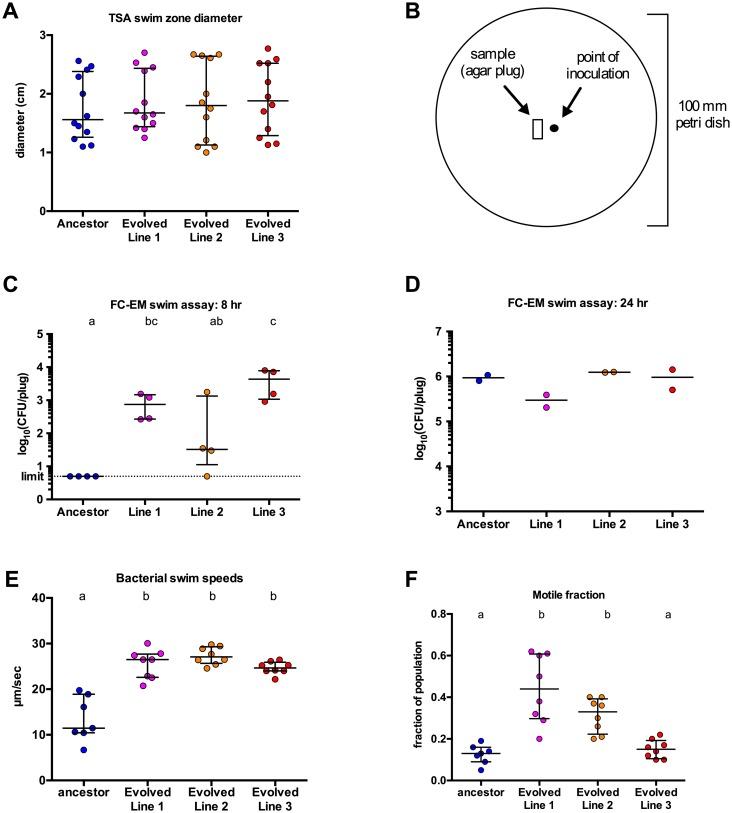
Fig 5. Evolved isolates demonstrate increased motility compared to the ancestor.
(A) Diameter of swim zones at 8 hours post inoculation for swim plate assay in rich media (TSA). (B) Template for FC-EM swim plate inoculation and sampling; the black dot is the point of inoculation; the small rectangle represents the site of sampling via gel extractor tool. (C and D) Abundance of strains in samples from FC-EM swim plate assays; motility was assessed by sampling an agar plug and enumerating migrated cells via plating at 8 hours (C) or 24 hours (D). (E and F) Bacterial swim speeds (E) and motile fraction of the population (F) were measured directly via live imaging; each data point is representative of an individual movie in which an average of 6,000 (minimum of 2,300) bacterial cells were tracked. Median and interquartile ranges are plotted for all data. Conditions that share a letter are not statistically different (ANOVA, log-transformed data for C). Data combined from two independent experiments for all assays. Underlying data for A–F are provided in S1 Data. CFU/gut, colony-forming unit per gut; FC-EM, fish-conditioned embryo medium; TSA, tryptic soy agar.

