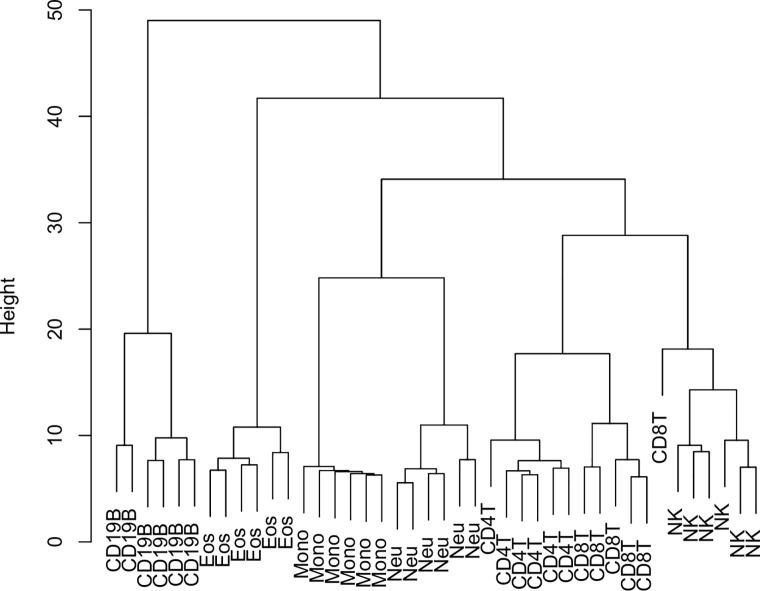
Fig 2. Hierarchical clustering of cell-sorted data from robust panels.
Tree represents an unsupervised clustering of cell-sorted sample data from only the CpGs found in the robust panels for the base cell-subtypes. Terminal nodes correspond to single samples. Each sample is labelled by the type of cell-subtype to which it corresponds.

