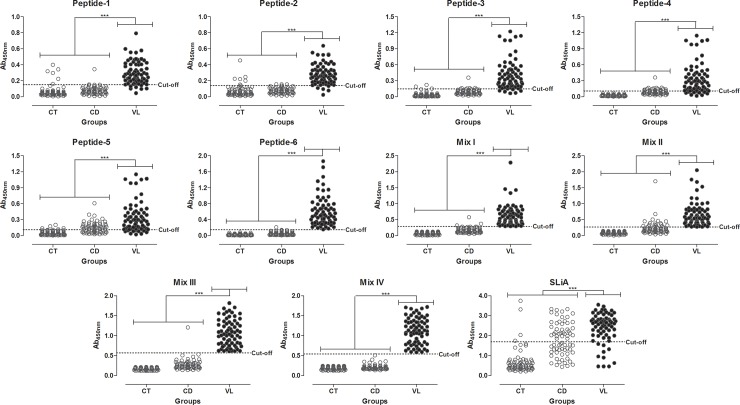
Fig 3. Comparison of reactivity from ELISA against Peptides 1–6, Mix I, II, III, IV and SLiA.
ELISA was performed in different groups of individuals. Groups negative for VL (white circle): control group (CT, n = 70), Chagas’ disease (CD, n = 68). Groups positive for VL (black circle): visceral leishmaniasis (VL, n = 70). The anti-peptides 1–6, Mix I, II, III, IV and SLiA reactivity between groups were compared by Kruskal-Wallis followed by Dunn’s post-test for multi-group comparisons. The differences were considered statistically significant at ***p<0.001, highlighted by connecting lines. Cut-offs were determined by ROC curves.

