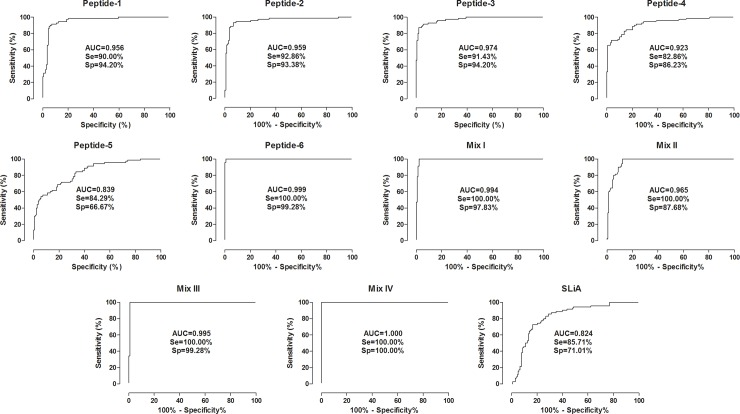
Fig 4. Comparison of ROC curves obtained from Peptides 1–6, Mix I, II, III, IV and SLiA.
ROC-curve analysis was applied to define the appropriated cut-off to discriminate OD values from VL negative groups represented by healthy and T. cruzi infected patients (CT, n = 70; CD, n = 68) and VL positive groups (VL, n = 70). Additional performance parameters were also calculated and provided in the figure, including the area under the curve (AUC), the sensitivity (Se) and the specificity (Sp).

