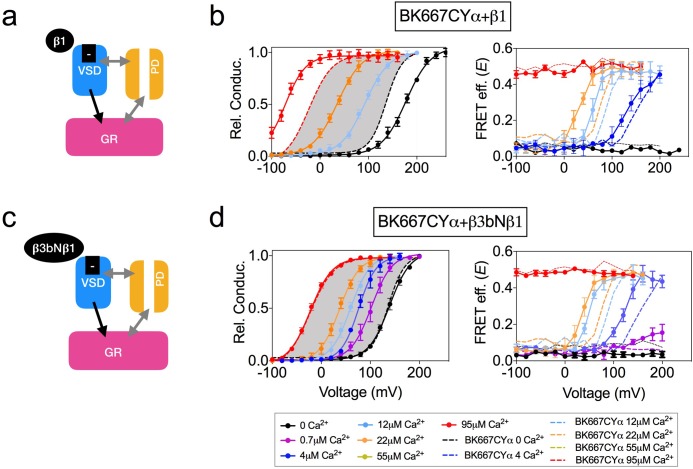
Figure 3. Co-expression with β subunits.
(a) β1 subunits have been shown to directly regulate VSD function, shifting Vh(j) to more negative values (b) Left panel, G-V curves obtained at several Ca2+concentrations after co-expression of BK667CY with the β1 subunit, which induces a leftward shift in the E-V curves obtained simultaneously (right). (c) β3bNβ1 chimeras produce similar effects to β1 on VSD function, since they retain the N-terminal region of β1 (Castillo et al., 2015). (d) G-V (left) and E-V curves (right) of BK667CY α subunits co-expressed with the β3bNβ1 chimera. Data corresponding to each Ca2+ concentration are color-coded as indicated in the legend at the bottom. Colored dashed lines represent the G-V and E-V curves corresponding to BK667CYα channels (Miranda et al., 2013; Miranda et al., 2016). The solid curves in the G-V graphs represent Boltzmann fits. The full range of G-V curves from 0 μM Ca2+ to 95 µM Ca2+ from BK667CY is represented as a grey shadow in left panels (b and d), for reference. Data points and error bars represent average ± SEM (n = 3–10; N = 2–4).


