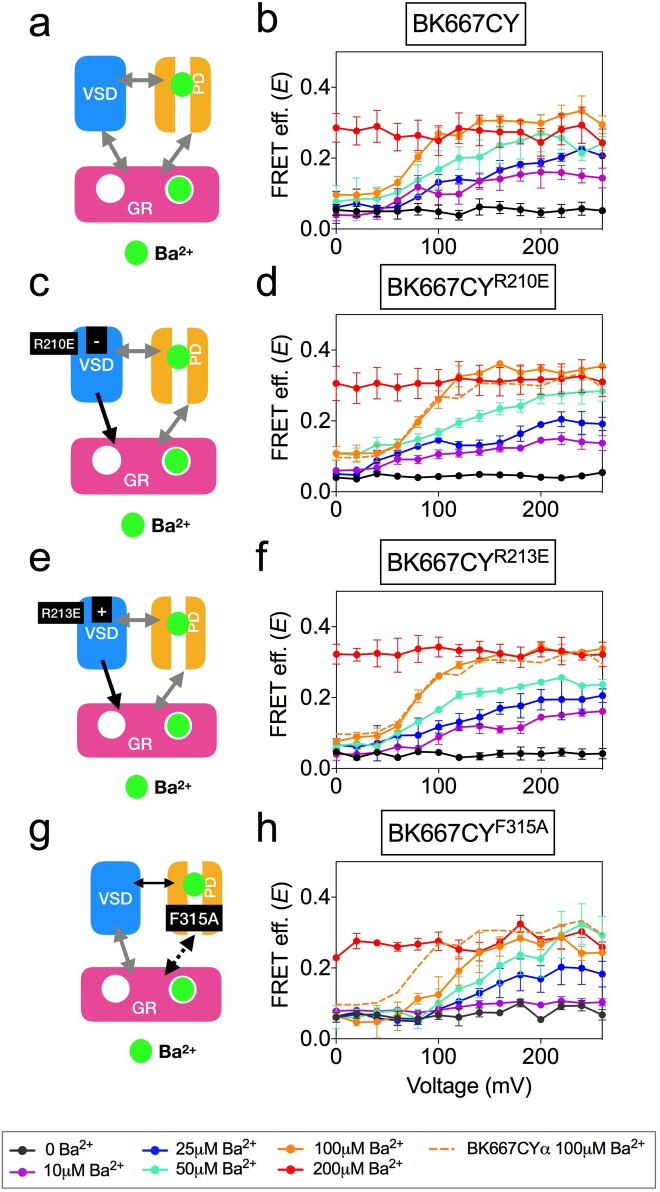
Figure 6. Voltage dependence of gating ring movements triggered by Ba2+.
(a) The RCK2 site is selectively activated by Ba2+, which additionally induces pore block. (b) FRET efficiency (E) data obtained at several Ba2+ concentrations from BK667CY constructs (Miranda et al., 2016). (c) Effect of the VSD R210E mutation after selective activation of the RCK2 binding site by Ba2+. (d) E-V curves obtained at several Ba2+ concentrations from BK667CYR210E constructs. (e) Effect of the VSD R213E mutation after selective activation of the RCK2 binding site by Ba2+. (f) E-V curves obtained at several Ba2+ concentrations from BK667CYR213E constructs. (g) Effect of the F315A mutation after selective activation of the RCK2 binding site by Ba2+ (h) E-V curves obtained at several Ba2+ concentrations from BK667CYF315A constructs. Data corresponding to each Ba2+ concentration are color-coded according to the legend at the bottom. For reference, the curve corresponding to 100 μM Ba2+ from the BK667CY construct shown in (b) is also shown as a colored dashed line in panels (b, d, f and h). Data points and error bars represent average ± SEM (n = 4–6; N = 2–3).


