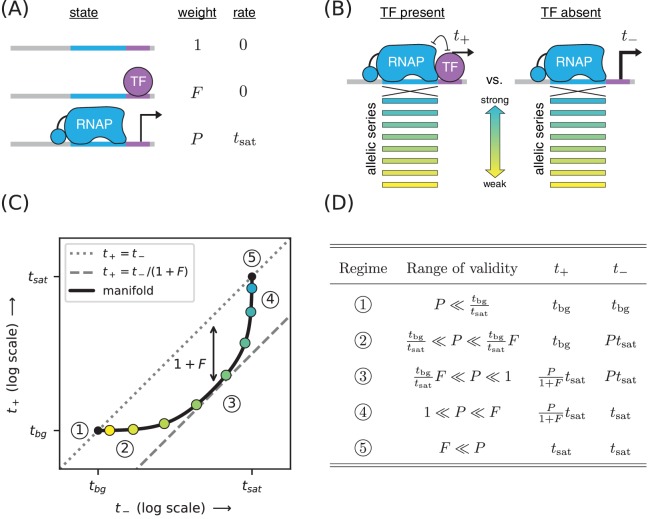
Figure 1. Strategy for measuring TF-DNA interactions.
(A) A thermodynamic model of simple repression. Here, promoter DNA can transition between three possible states: unbound, bound by a TF, or bound by RNAP. Each state has an associated Boltzmann weight and rate of transcript initiation. is the TF binding factor and is the RNAP binding factor; see text for a description of how these dimensionless binding factors relate to binding affinity and binding energy. is the rate of specific transcript initiation from a promoter fully occupied by RNAP. (B) Transcription is measured in the presence () and absence () of the TF. Measurements are made for an allelic series of RNAP binding sites that differ in their binding strengths (blue-yellow gradient). (C) If the model in panel A is correct, plotting vs. for the promoters in panel B (colored dots) will trace out a 1D allelic manifold. Mathematically, this manifold reflects Equation 1 and Equation 2 computed over all possible values of the RNAP binding factor while the other parameters (, ) are held fixed. Note that these equations include a background transcription term ; it is assumed throughout that and that is independent of RNAP binding site sequence. The resulting manifold exhibits five distinct regimes (circled numbers), corresponding to different ranges for the value of that allow the mathematical expressions in Equations 1 and 2 to be approximated by simplified expressions. In regime 3, for instance, , and thus the manifold approximately follows a line parallel (on a log-log plot) to the diagonal but offset below it by a factor of (dashed line). Data points in this regime can therefore be used to determine the value of . (D) The five regimes of the allelic manifold, including approximate expressions for and in each regime, as well as the range of validity for .

