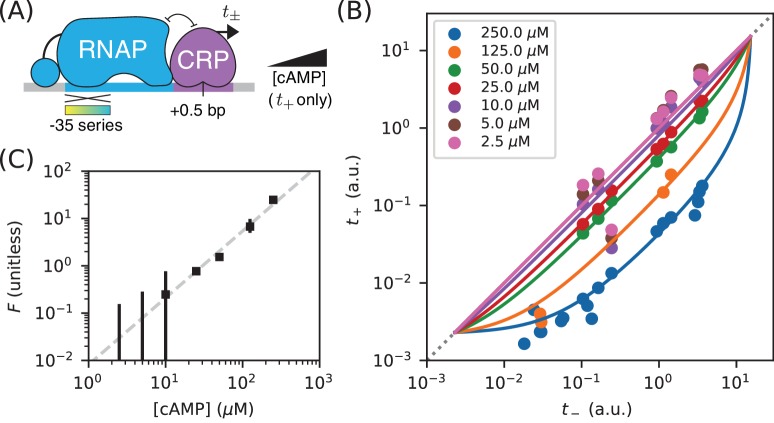
Figure 3. Measuring in vivo changes in TF concentration.
(A) Allelic manifolds were measured for the +0.5 bp occlusion promoter architecture using seven different concentrations of cAMP (ranging from 2.5 µM to 250 µM) when assaying . (B) As expected, these data follow allelic manifolds that have cAMP-dependent values for the CRP binding factor . (C) Values for inferred from the data in panel B exhibit a nontrivial power law dependence on [cAMP]. Error bars indicate 68% confidence intervals determined by bootstrap resampling.

