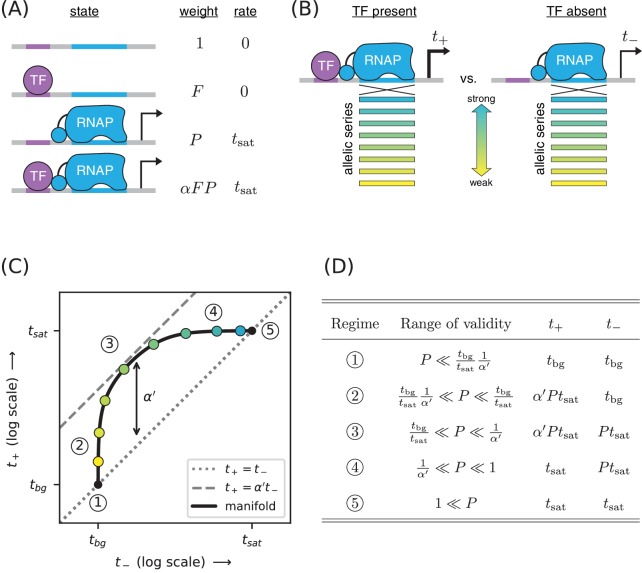
Figure 4. Strategy for measuring TF-RNAP interactions.
(A) A thermodynamic model of simple activation. Here, promoter DNA can transition between four different states: unbound, bound by the TF, bound by RNAP, or doubly bound. As in Figure 1, is the TF binding factor, is the RNAP binding factor, and is the rate of transcript initiation from an RNAP-saturated promoter. The cooperativity factor quantifies the strength of the interaction between DNA-bound TF and RNAP molecules; see text for more information on this quantity. (B) As in Figure 1, expression is measured in the presence () and absence () of the TF for promoters that have an allelic series of RNAP binding sites (blue-yellow gradient). (C) If the model in panel A is correct, plotting vs. (colored dots) will reveal a 1D allelic manifold that corresponds to Equation 4 (for ) and Equation 2 (for ) evaluated over all possible values of . Circled numbers indicate the five regimes of this manifold. In regime 3, where is the renormalized cooperativity factor given in Equation 5; data in this regime can thus be used to measure . Separate measurements of , using the strategy in Figure 1, then allow one to compute from knowledge of . (D) The five regimes of the allelic manifold in panel C. Note that these regimes differ from those in Figure 1D.

