Figure 1.

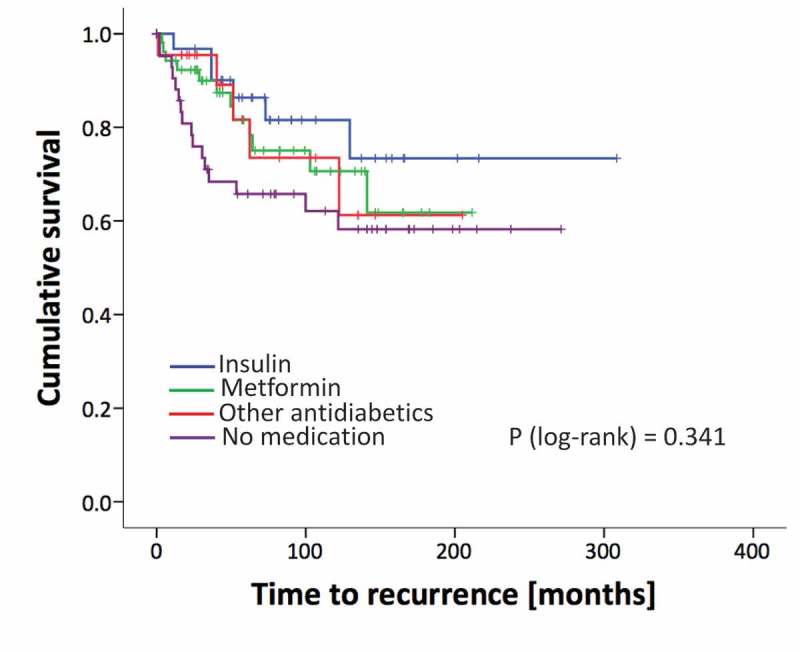
Kaplan Meier curves of recurrence rates (BCR) of patients analyzed for different treatment groups. p-value from the log-rank test.

Kaplan Meier curves of recurrence rates (BCR) of patients analyzed for different treatment groups. p-value from the log-rank test.