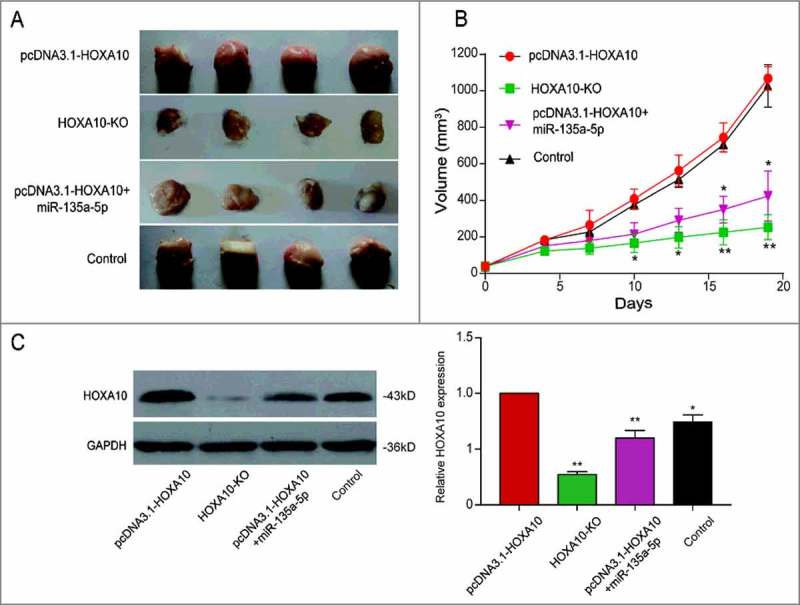
Figure 6.

Inhibitory effects of miR-135a-5p on tumor cells by targeting HOXA10in vivo. (A-B) The tumor volume of HOXA10 overexpression group was the largest, that of HOXA10-KO group was the smallest. Tumor growth of pcDNA3.1-HOXA10+miR-135a-5p group was impaired relatively (**P<0.01, *P<0.05, compared with pcDNA3.1-HOXA10 group). (C) Larger tumors always corresponded with higher level of HOXA10 expression. The HOXA10 expression in pcDNA3.1-HOXA10+miR-135a-5p group was lower compared with pcDNA3.1-HOXA10 group which was evaluated by WB. MiR-135a-5p could restrain the growth of tumor and the expression of HOXA10 (**P<0.01, *P<0.05, compared with pcDNA3.1-HOXA10 group).
