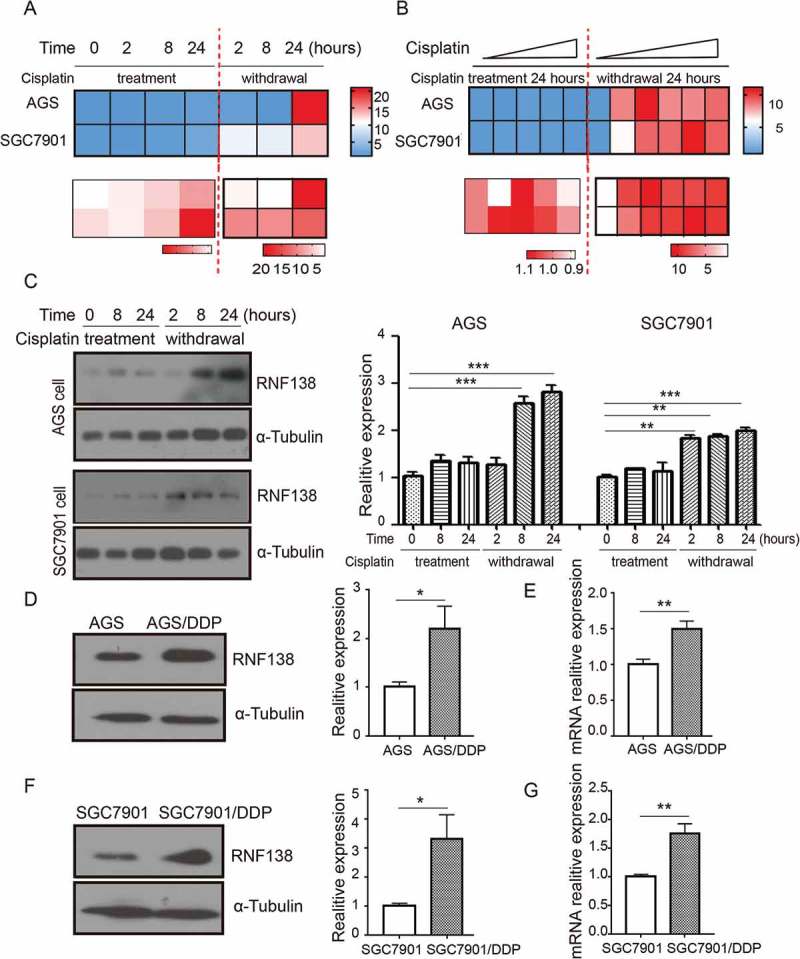
Figure 1.

RNF138 is upregulated during acquiring cisplatin resistance in GC cells. (A and B) Cluster heatmap of RNF138 mRNA expression profiles were detected with real-time qPCR using 0.5 μg/ml in AGS and 0.25 μg/ml in SGC7901 cells for the indicated cisplatin treatment time (A) and detected with the indicated cisplatin doses for continuous 24 h treatment or 24h after replacement in AGS and SGC7901 GC cells (B). Cisplatin treatment represented as cisplatin continuous stress for indicated time. Withdrawal represented as cisplatin continuous stress for 24 hours, and then replaced to normal medium for indicated time. β-actin served as loading control. (C) The expression of RNF138 was determined in AGS and SGC7901 cells with indicated cisplatin treatment time by immunoblotting analysis. α-Tubulin was used as the loading control. (D and E) The expression of RNF138 was determined in AGS and AGS/DDP cell lines by immunoblotting analysis (D) and real-time qPCR analysis (E). α-Tubulin and β-actin were used as loading controls, respectively. (F and G) The expression of RNF138 was determined in SGC7901 and SGC7901/DDP cell lines by immunoblotting analysis (F) and real-time qPCR analysis (G). α-Tubulin and β-actin were used as loading controls, respectively. Graphs show the mean of three experiments, and error bars represent SD. Statistically significant differences are shown by *, P < 0.05; **, P < 0.01; ***, P < 0.001.
