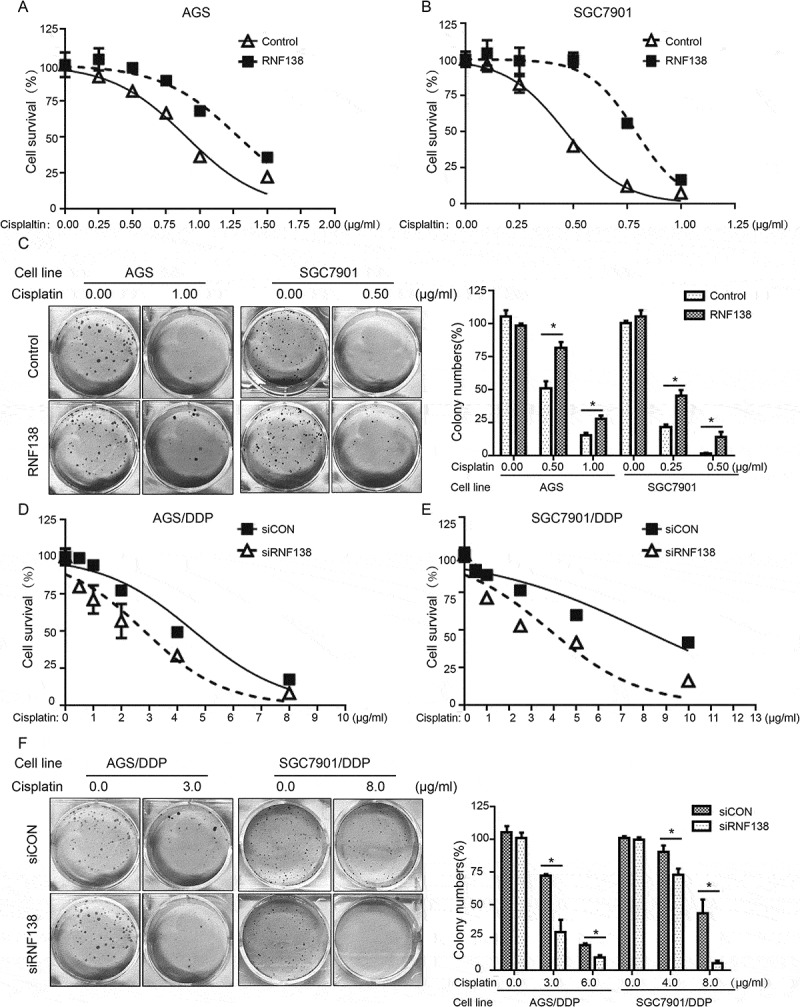
Figure 2.

RNF138 level determines the sensitivity of GC cells to cisplatin. (A, B) IC50 values were calculated in AGS (A) and SGC7901 (B) cells transfected with the empty vector or RNF138 using cytotoxicity assay. (C) Colony formation was detected in AGS and SGC7901 cells transfected with RNF138 compared with empty control vector. The normalized ratio of clonogenic assay was shown in the histogram. (D, E) IC50 values were calculated in AGS/DDP (D) and SGC7901/DDP (E) cells transfected with the control or siRNF138 using cytotoxicity assay. (F) Colony formation was detected in AGS/DDP and SGC7901/DDP cells transfected with the control or siRNF138. The normalized ratio of clonogenic assay was shown in the histogram and error bars represent SD. Statistically significant differences are shown by *, P < 0.05.
