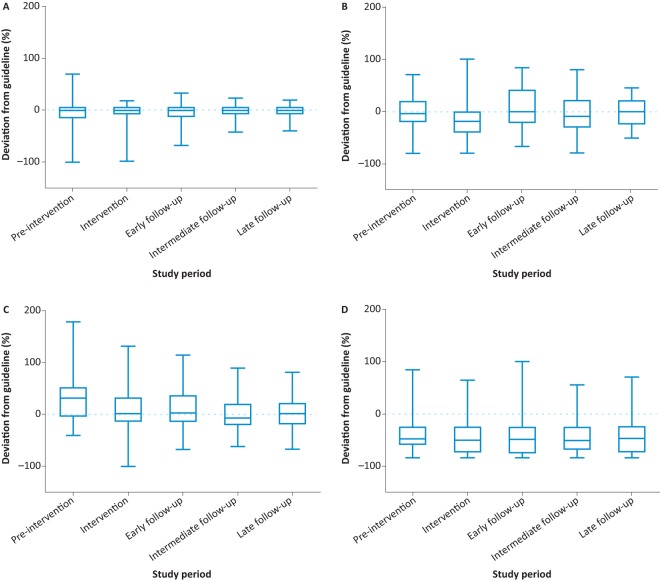
Fig 4.
Deviation from guidance for four primary drivers for diabetic ketoacidosis management. A – fixed rate intravenous insulin infusion; B – fluids; C – hourly glucose measurement; D – hourly ketone measurement. There was an increased proportion of values for fixed rate intravenous insulin infusion within the 20% of guideline value following our interventions during the study (67% at pre-intervention to 92% in the late follow-up period (p=0.002)). A similar trend was noted for hourly glucose measurements (the proportion of patients within 20% variation of the guideline increased from 33% to 47%); however, this was not statistically significant (p=0.06). There was no significant change in the variation of fluid prescription and ketone measurements.

