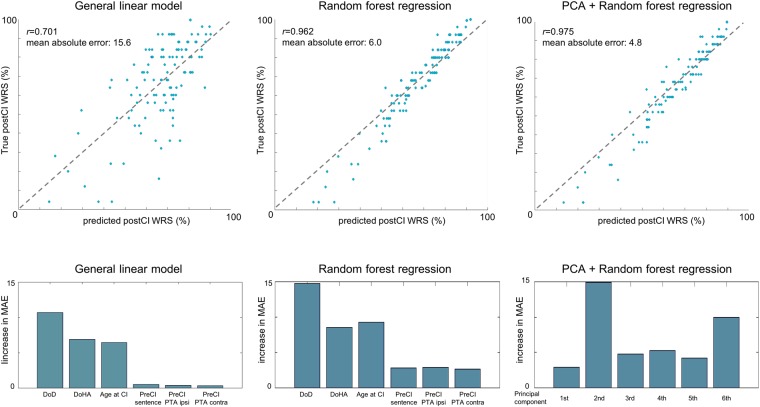
Figure 2.
Predictive performance of postoperative word recognition using different models including a general linear model (GLM; 1st column) and a random forest regression (RFR; 2nd column). We also performed principal component analysis (PCA) to reconstruct features regarding covariance of the original predictive variables and fed the new features to the RFR (3rd column). Upper: prediction results – blue circles indicate individual patients. Gray dot lines represent the ideal fitting where the error is 0. The farther a circle is from the line, the less accurate its prediction is. The nonlinear RFR outperformed the result of GLM. The PCA + RFR model further improved slightly the result of RFR only. Lower: Importance of each feature in terms of decrease in mean absolute error (MAE) when the given feature was omitted from the prediction process. Abbreviations: DoD – duration of deafness, DoHA – duration of hearing aid use, Age at CI – age at cochlear implantation, PreCI Sentence - sentence recognition score measured preoperatively; preCI PTA ipsi/contra – preoperative PTA in CI ear/in the contralateral ear; WRS: word recognition score.

