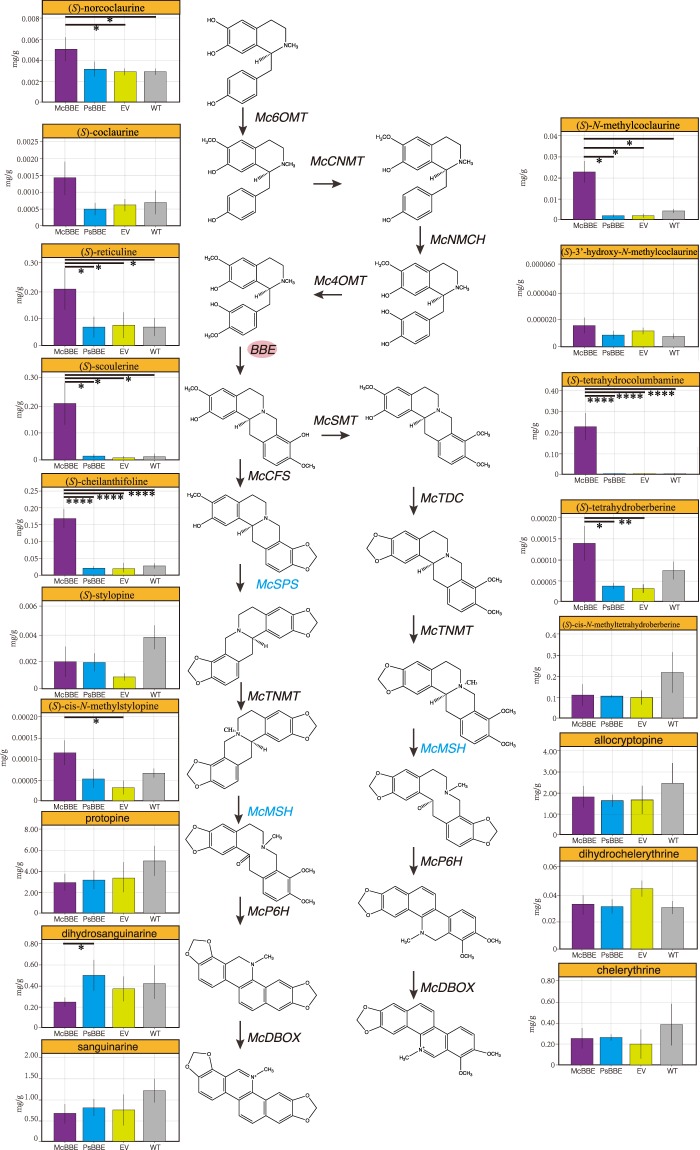
Figure 3.
The analysis of alkaloid levels (from (S)-norcoclaurine to SAN and CHE) in transgenic (pcambia2301 + McBBE, pcambia2301 + PsBBE, pcmbia2301) and WT M. cordata plants were negative control. Data represent means ± SD (n = 3). Asterisks denote the significant changes (* means P < 0.05, ** means P < 0.01, *** means P < 0.005, **** means P < 0.001). McMSH and McSPS genes in this pathway still uncharacterized, we mark it in blue. EV means empty vector, WT means wild type.

