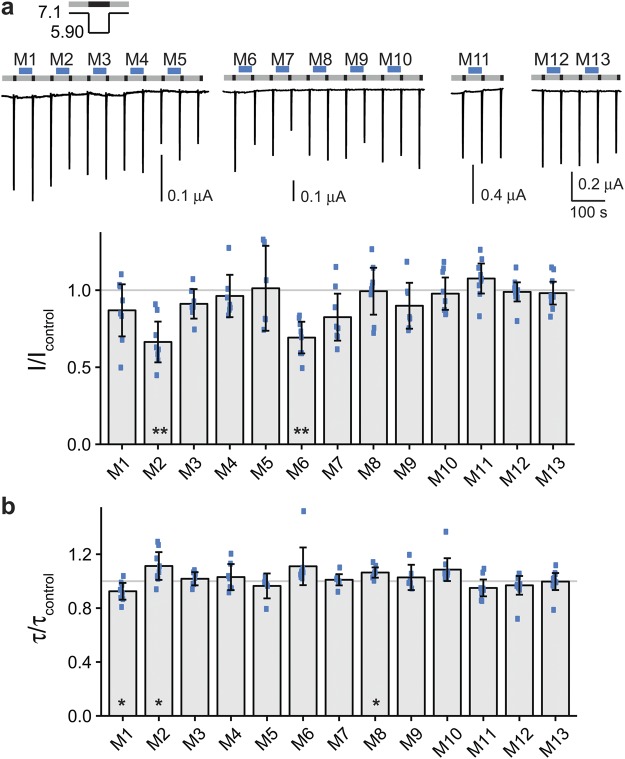
Figure 3.
Effect of peptide mixes on ASIC1b current amplitude and desensitization. (a) Top, representative current traces of ASIC1b expressing oocytes conditioned with pH 7.1 (grey bars) and activated with pH 5.9 (black bars). Peptide mixes 1–13 (M1-M13) were present in the conditioning solution as indicated by the blue bars with a concentration of 20 μM per individual peptide. Bottom, scatter plot showing ratios of I to Icontrol. Bars show the mean and error bars the SD. (b) Scatter plot showing ratios of τ to τcontrol. *p < 0.05, **p < 0.01 (paired Student’s t-test).

