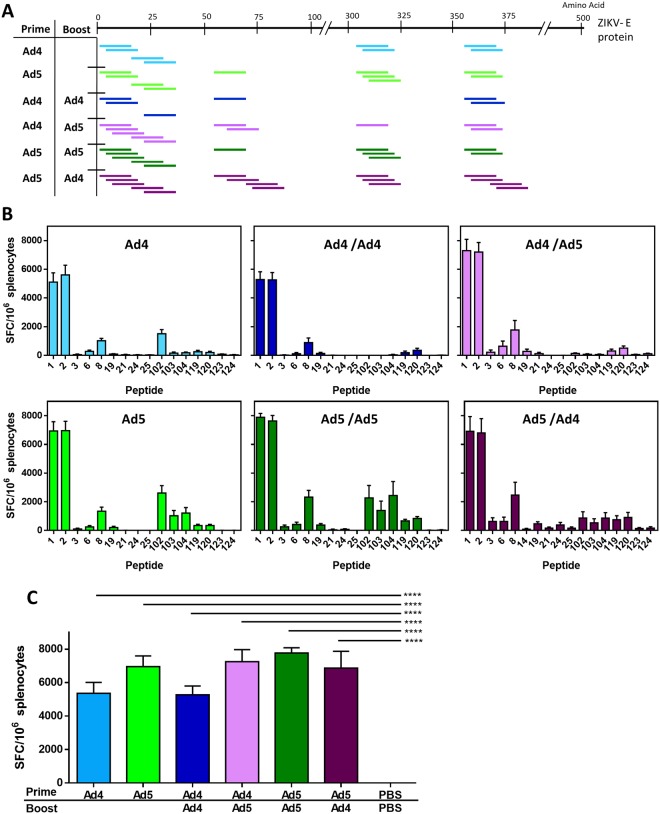
Figure 3.
T-cell epitope mapping in response to vaccination. (A,B) Splenocytes from the vaccinated C57BL/6 mice (n = 5) were harvested. T-cell epitopes against ZIKV-E protein were mapped using a 164 peptide array of 15-mers with 13 amino acid overlap spanning the entire ZIKV-E protein. Peptides were considered positive if the response was 4 times the sham vaccinated mice. Positive peptides for each vaccination group are indicated in (A). The level of response seen against each positive peptide are reported as spot-forming cells (SFC) per million splenocytes (B). Peptides 1 and 2 encompass a previously described CD8+ immunodominant T-cell epitope37. The T-cell response against this epitope is shown as spot-forming cells (SFC) per million (C) (****p < 0.0001; one-way ANOVA with Bonferroni multiple comparisons). Data are expressed as the mean with standard error (SEM).

