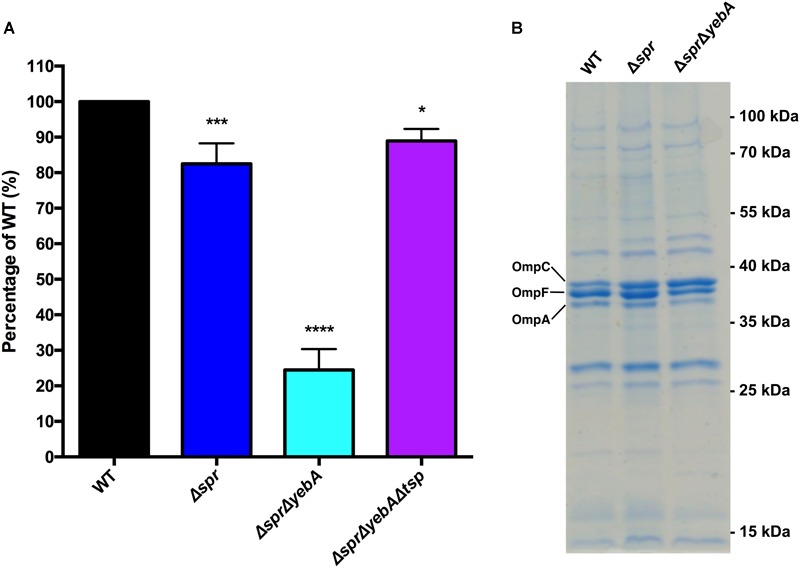
FIGURE 2.

Detergent sensitivity and membrane protein profile of muramyl endopeptidase mutants. (A) For probing detergent sensitivity 105 bacteria of each strains was incubated in 0.5% DOC for 30 min, where after the bacterial viable colonies were enumerated. Results are presented as relative CFU yield in relation to the wild-type. The graph shows the mean value and the standard error of the mean of three independent replicates. Statistical test was an one-way ANOVA with Dunnett’s correction for multiple comparisons when comparing the mutants to the wild-type. ∗ = p < 0.05, ∗∗∗ = p < 0.001, and ∗∗∗∗ = p < 0.0001. (B) SDS-PAGE gel revealing the outer membrane protein profiles of the wild-type and mutant strains. The positions of pre-stained molecular weight markers are indicated at the right. The labeling of OmpC, OmpF, and OmpA is based on comparison with published data (Sukupolvi et al., 1984; Liu et al., 2016; Choi et al., 2018).
