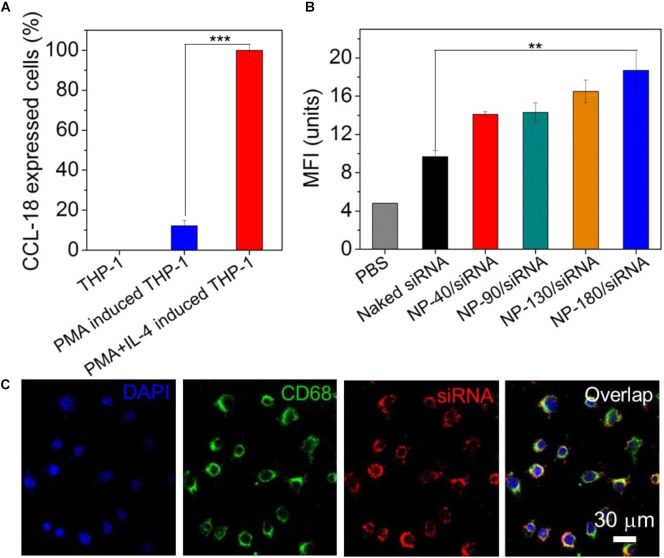
FIGURE 6.
(A) The mRNA level of CCL-18 in the THP-1 cells treated with PMA and IL-4. (B) MFI determined by FACS analysis of the THP-1-originated macrophages incubated with the Cy5-siCCL-18 loaded NPs for 4 h at a siRNA concentration of 200 nM. (C) Fluorescent images of the macrophages incubated with the Cy5-siCCL-18 loaded NP-180 for 4 h at a siRNA concentration of 200 nM. The nuclei and macrophages were staining with DAPI as blue fluorescence and anti-CD68 as green fluorescence, respectively. ∗∗P < 0.01; ∗∗∗P < 0.001.

